Features
Software Metrics Machine (SMM) offers multiple ways to analyze and visualize engineering metrics.
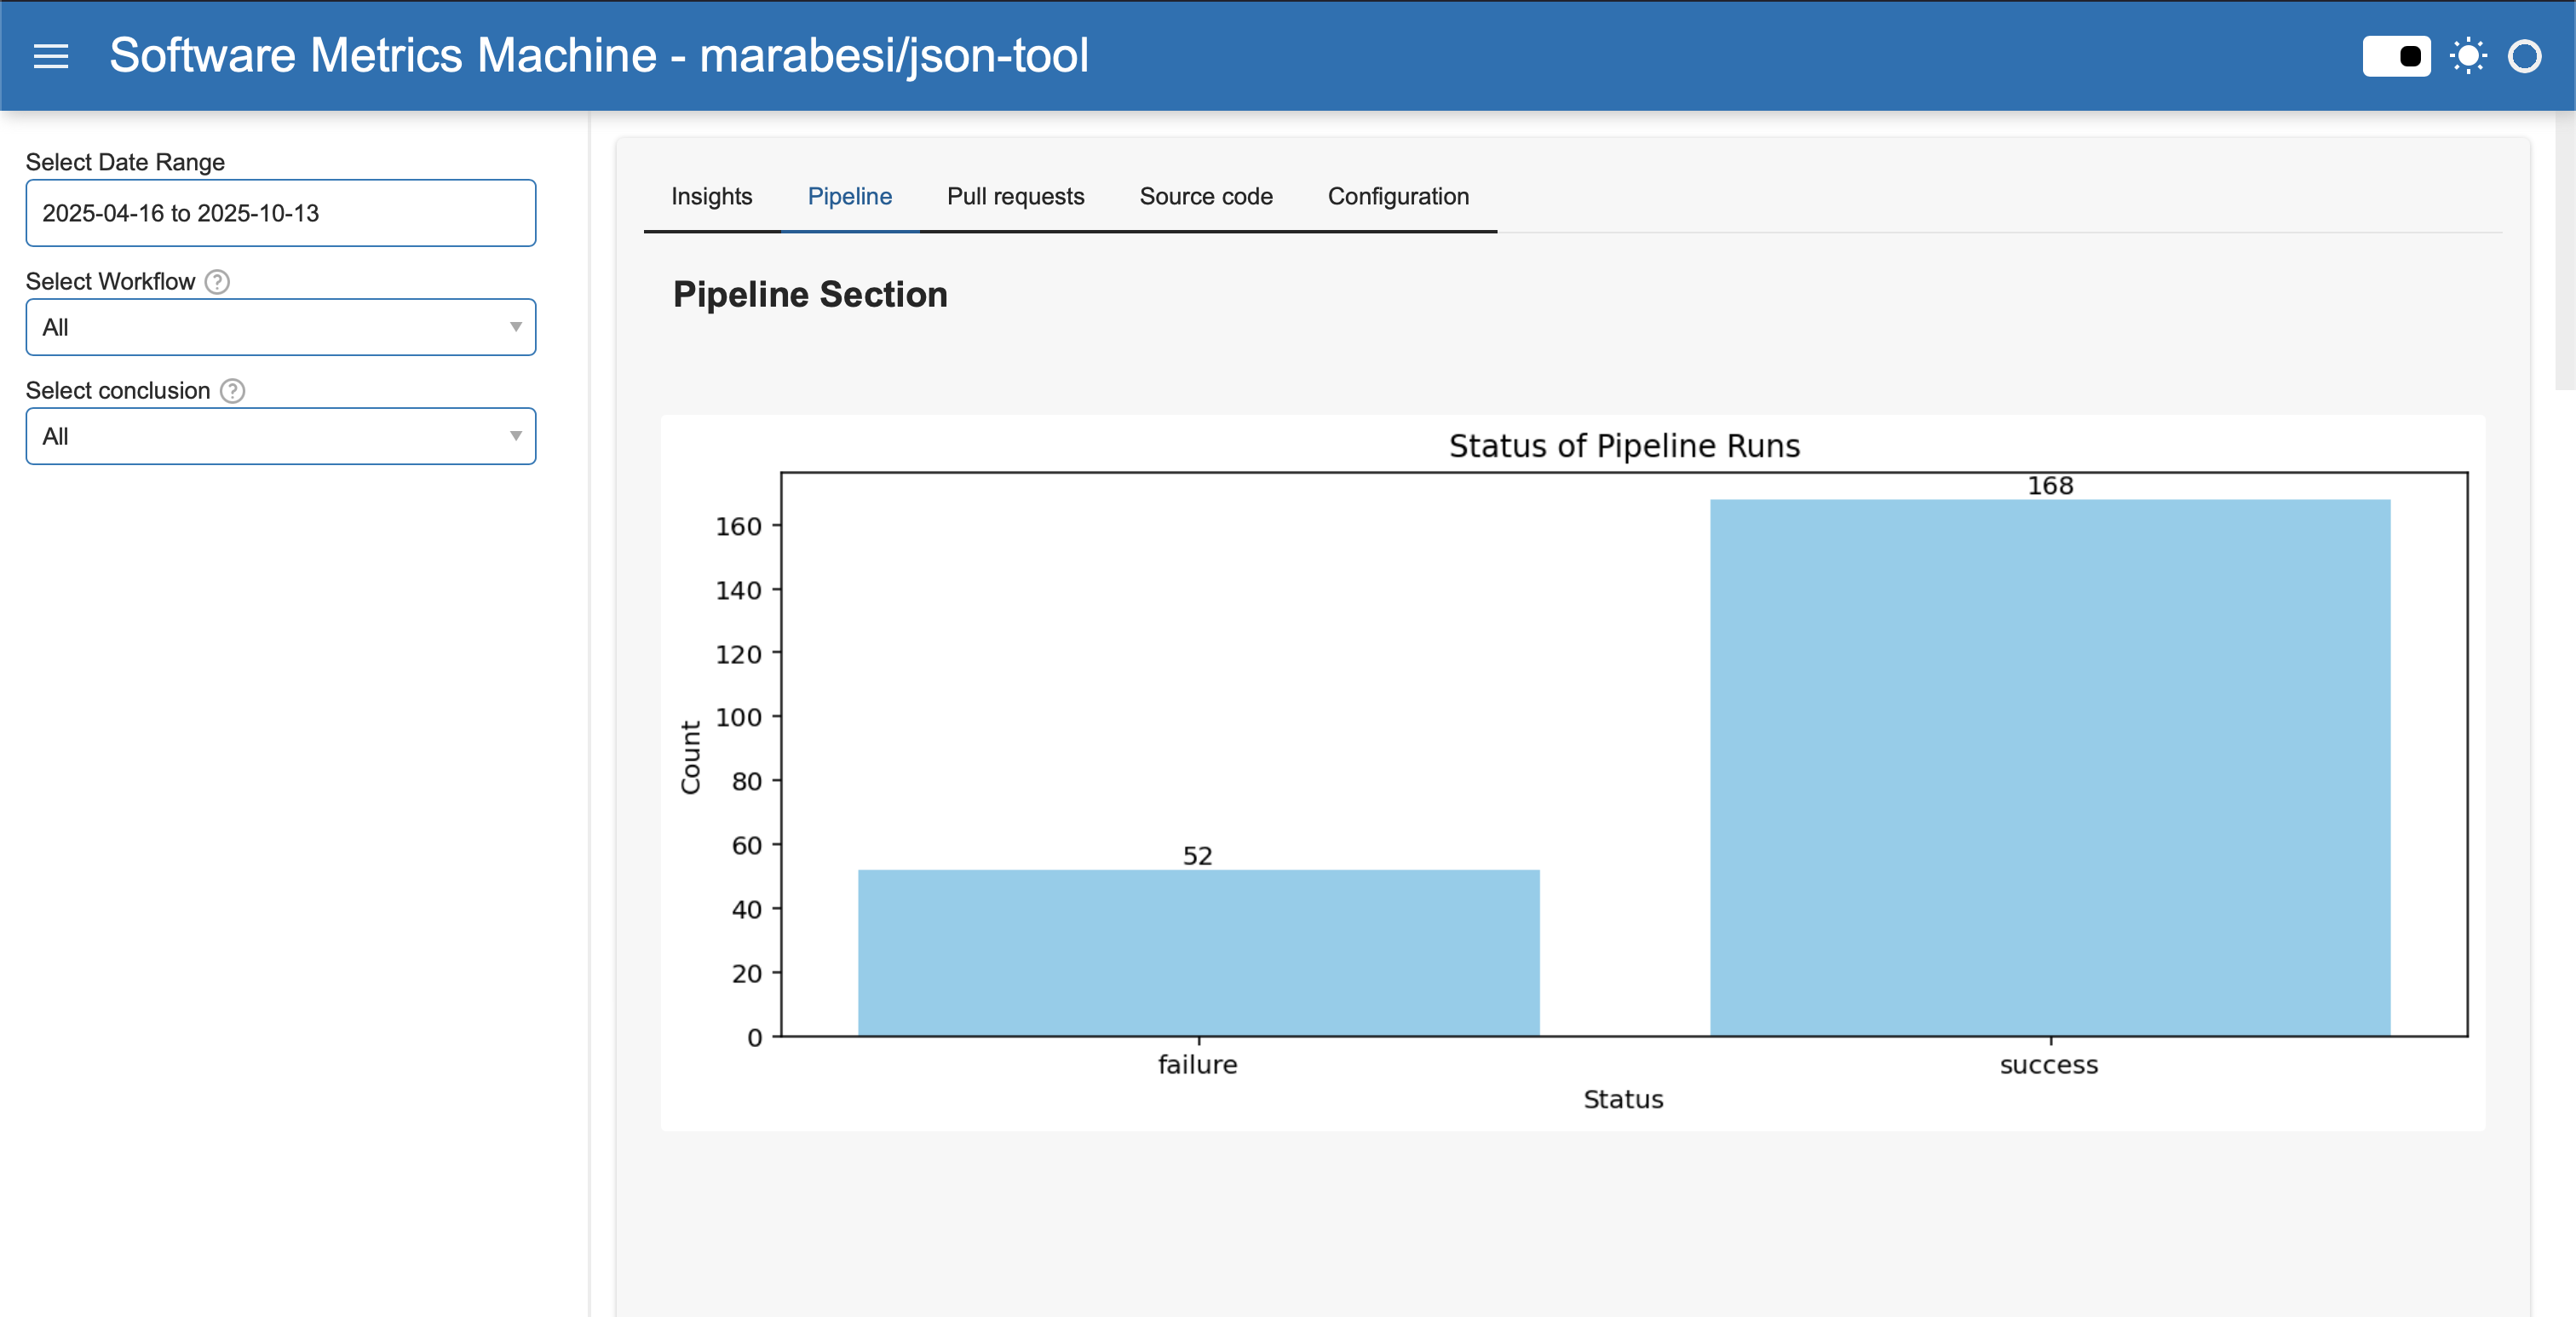
The dashboard provides the following features:
- Data Visualization: View your data in various formats such as tables, charts, and graphs.
- Filtering and Sorting: Filter by date, timezone, provider-specific fields, authors, labels, paths, branches, and events.
- Saved Views: Save frequently used filters per project and dashboard section.
- Project Switching: Move between configured repositories from the project drawer.
- Cross-domain Insights: Change requests, pipelines, source code, and SonarQube.
- Engineering Health Report: leadership scorecards across delivery, quality, collaboration, and architecture in the dashboard or CLI.
- References and Targets: Review the sources used to define metric targets and recommendations.
See Dashboard for the shared dashboard behavior.
CLI
For CLI access, run:
bash
smmMain command groups:
smm change-requestssmm pipelinessmm codesmm architecturesmm jirasmm sonarqubesmm dashboardsmm toolssmm health-check
REST API
SMM provides a REST API for integrations and automation.
Start REST API with:
bash
smm dashboard serveSwagger docs are available at http://localhost:8000/api/docs by default.
See REST API for endpoint overview.
Explore
Each feature has its own page: