Insights
The insights section of the dashboard provides a comprehensive overview of key metrics and trends derived from your data. It includes visualizations such as the time that it takes to land code in production and meta data derived from your data.
For example, you can track metrics like Deployment Frequency, Lead Time for Changes, Change Failure Rate, and Mean Time to Recovery (MTTR). These insights help you understand the efficiency and effectiveness of your development and deployment processes. Those come from your pipelines. However, pairing index comes from your git history, from the source code.
The dashboard tab also shows recommendations. Recommendations combine target values, metric thresholds, and the selected filters to highlight actions worth investigating. Each recommendation links to the relevant dashboard section while preserving filter context.
Summary cards
The Insights tab includes three summary cards:
- Pairing Index: percentage of analyzed commits with co-authors, plus paired commit count.
- Pipeline Runs: total runs, success, in-progress, queued, and first/last data frame.
- Change Requests: total change requests, merged, closed, open, and first/last data frame.
The status values in the Pipeline Runs and Change Requests cards link to the related dashboard page with matching filters applied.
Each card has a CLI equivalent:
| Card | CLI command |
|---|---|
| Pairing Index | smm code pairing-index |
| Pipeline Runs | smm pipelines summary |
| Change Requests | smm change-requests summary |
Deployment Frequency
Works with:
GitHubDeployment Frequency measures how often code is deployed to production. A higher deployment frequency indicates a more agile and responsive development process.
The deployment frequency is calculated by dividing the number of deployments by the number of deployments in a given time period. To track the deployment frequency, Smm requires a pipeline that deploys to production.
This is configured in the configuration file. You need to specify the pipeline and the job that deploys to production.
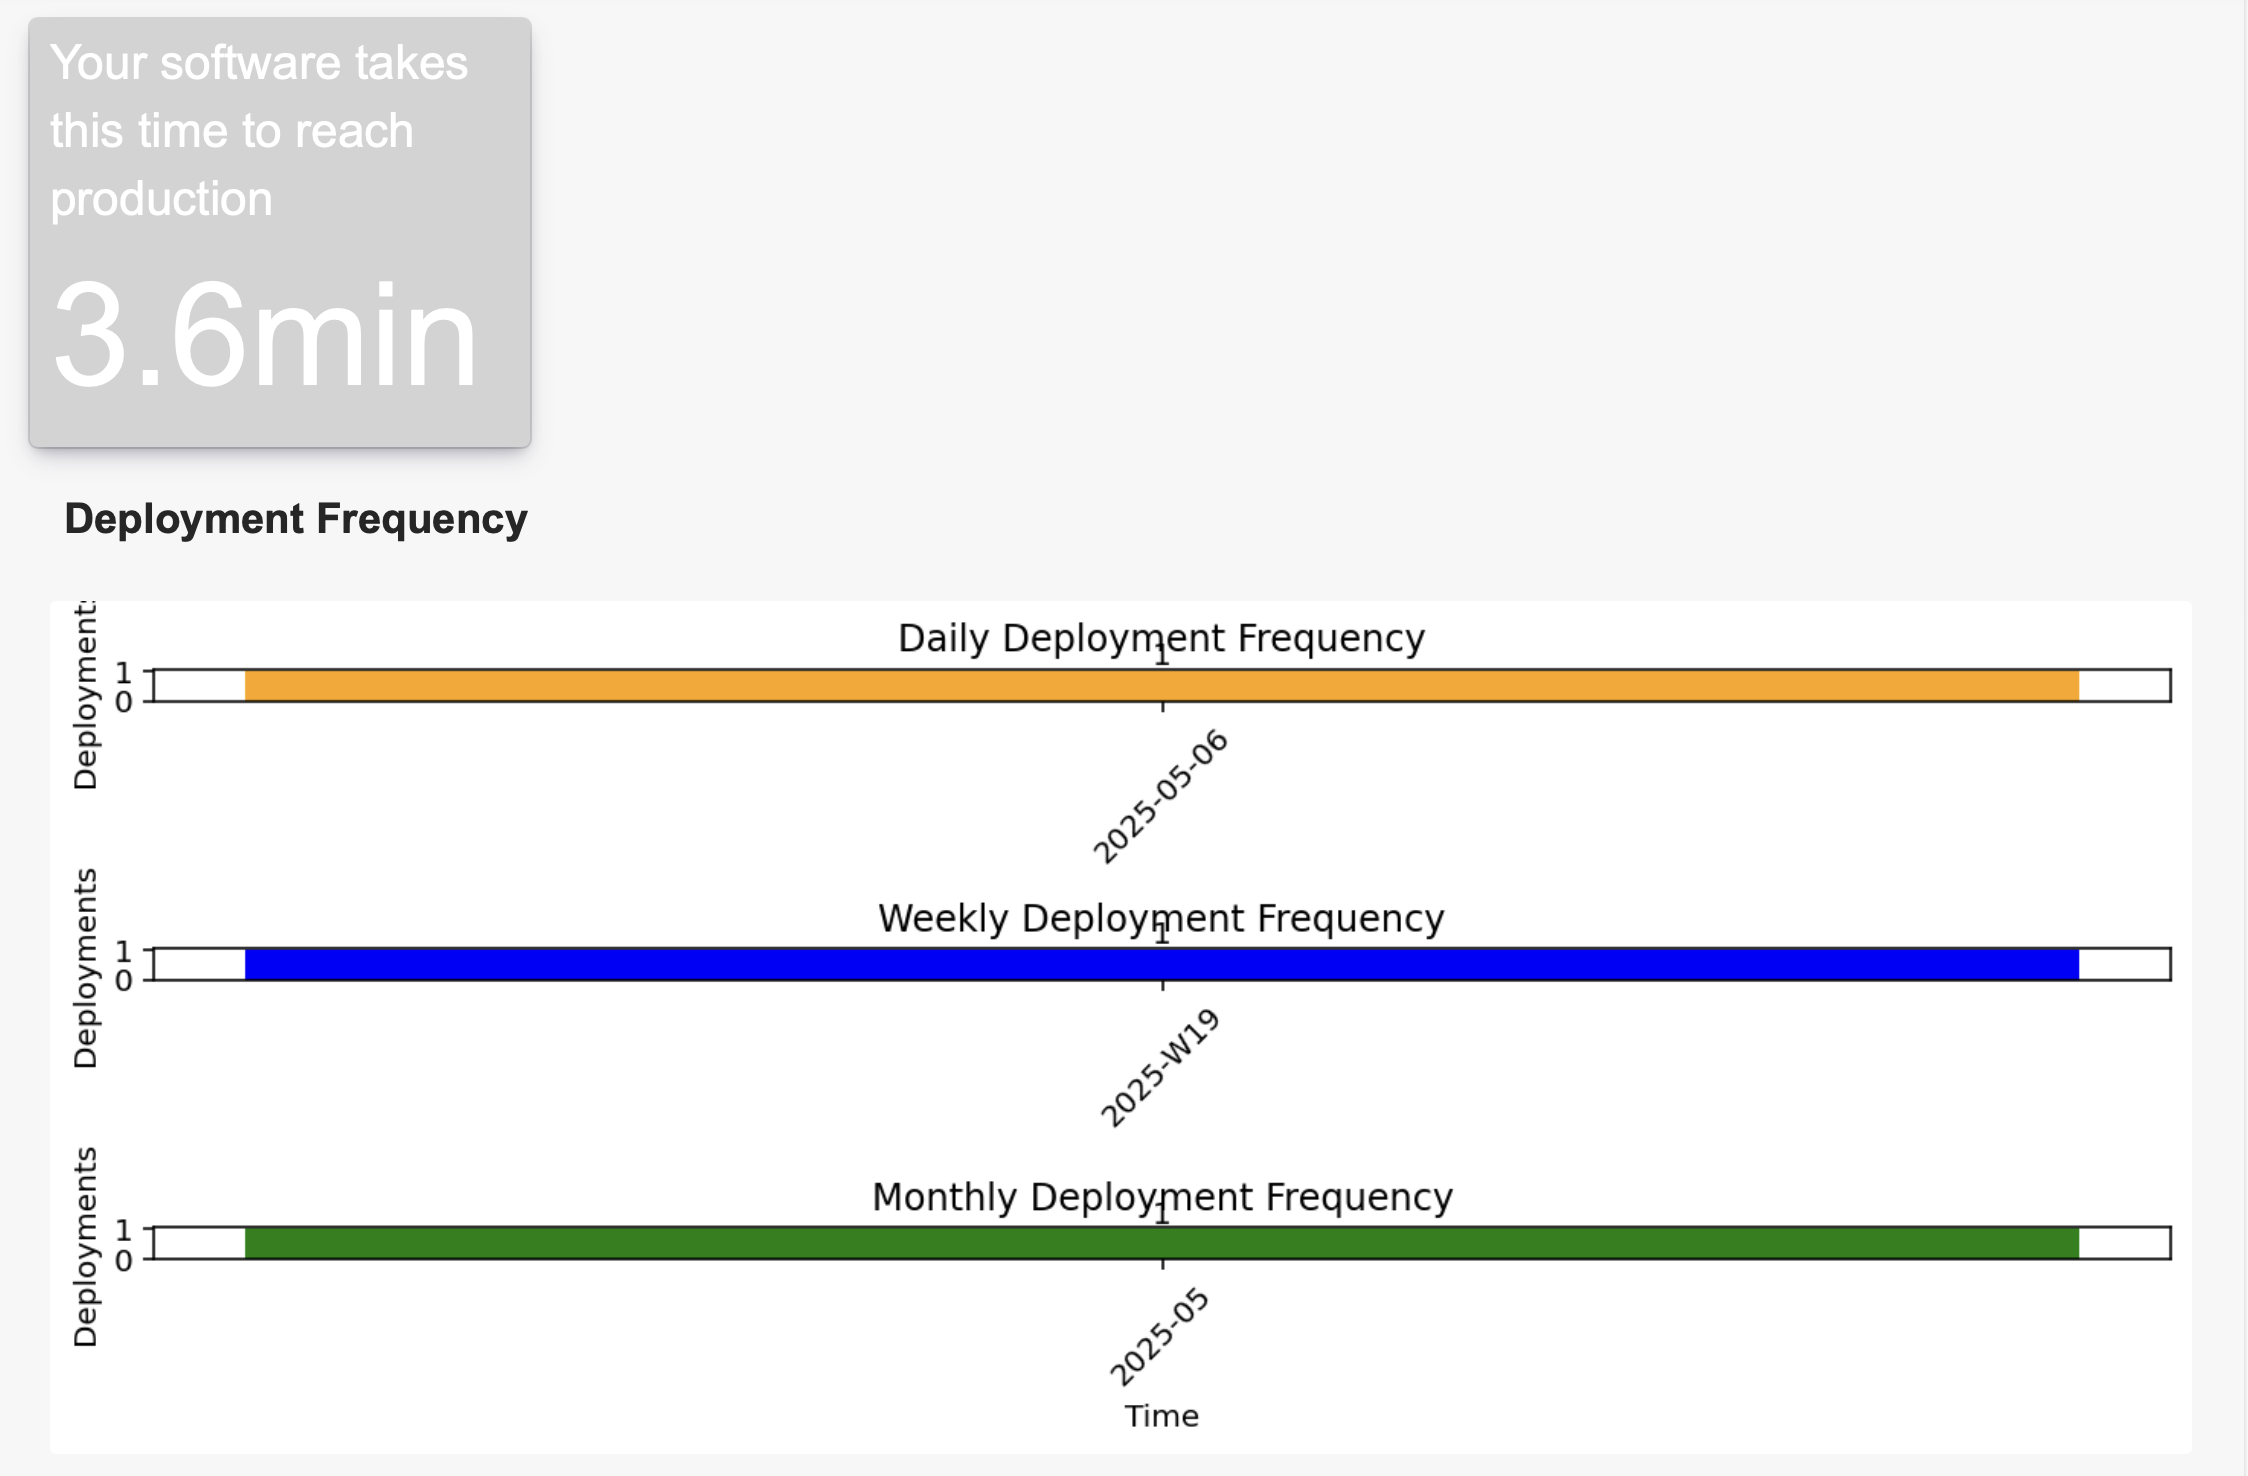
In the dashboard, deployment frequency can show multiple configured deployment targets. Use the target toggles to hide or show individual deployment pipelines and jobs. The chart also provides Show all and Hide all actions when multiple targets are available.
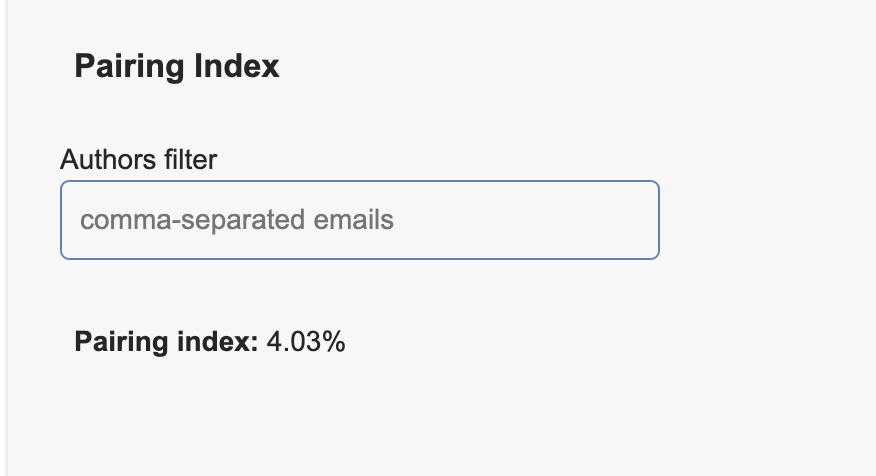
Pairing index
Works with:
GitHubGitLabBitbucketany git based repositoryThe Pairing Index provides insights into collaboration within your development team by analyzing how often developers work together on code changes. A higher pairing index suggests a more collaborative environment, which can lead to improved code quality and knowledge sharing.
Dashboard filters
Insights supports global date filters and uses pipeline, change request, and source-code filters when building recommendations and summary cards.
| Dashboard filter | Backend query parameter |
|---|---|
startDate | start_date |
endDate | end_date |
timezone | timezone |
The shared date picker, timezone behavior, saved views, and tab navigation are documented in Dashboard.