Change Requests
Works with:
GitHubThis dashboard provides insights into change request activity within a software repository. It includes charts and tables designed to highlight review speed, comment patterns, throughput, themes, and team dynamics.
Each chart in the dashboard is interactive and supports filtering by author, labels, and date range, allowing you to drill down into the data that matters most for your team. This enables you to monitor team flow and identify bottlenecks.
Fetching data
Fetching the data before operating it is the most first step to get started with metrics. This application provides utilities to fetch data based on date time criteria as it is a standard to use it as a cut off for data analysis.
NOTE
Fetching data may take a while depending on activity in the repository, by default it fetches every change request and every workflow run in the repository.
Date-only values passed to --start-date and --end-date are interpreted with the selected project's configured timezone from smm_config.json. If the project does not set timezone, SMM uses the project-specific SMM_TIMEZONE environment variable, then UTC.
smm change-requests fetch| Option | Description | Example |
|---|---|---|
| Start date | Fetches change requests created after a date. | --start-date=2025-01-01 |
| End date | Fetches change requests created before a date. | --end-date=2025-12-31 |
| Filters | Allows passing raw filters directly to the provider's API. See your provider's API docs for available fields. For GitHub: list pull requests | --raw-filters=state=open |
| Force | By default a file is stored with the retrieved data to avoid refetching it again. However, using this parameter bypass this cache. | --force=true |
| Update | Incrementally fetch only newer items and merge with existing cache. | --update=true |
Filtering the data fetch from change requests by date is done logically while fetching the data. Provider APIs may require all results to be retrieved before client-side date filtering can be applied.
Examples - Fetch change requests
Fetching change requests from the last 3 months:
smm change-requests fetch --start-date=2025-09-01 --end-date=2025-12-01Fetching change requests created between January 1, 2025, and June 30, 2025:
smm change-requests fetch --start-date=2025-01-01 --end-date=2025-06-30Using a temporary timezone for CLI execution:
YOUR_ORG_FRONTEND_APP_SMM_TIMEZONE=Europe/Madrid smm --project your-org/frontend-app change-requests fetch --start-date=2025-01-01 --end-date=2025-06-30Fetching only open change requests:
smm change-requests fetch --raw-filters=state=open,head=mainForcing the fetch to ignore already fetched change requests (this overrides the data stored):
smm change-requests fetch --force=trueFetch change request comments
Change requests often have comments that provide insights into the review process. However, in order to fetch comments for change requests, you must first fetch the change requests using the smm change-requests fetch command. The comments are not fetched by default to optimize data retrieval and respect API rate limits. Before fetching the comments, it first uses the change requests data already fetched to get the comments for each change request using the property review_comments_url from each change request.
smm change-requests fetch-comments| Option | Description | Example |
|---|---|---|
| Start date | The change requests created date to filter after this date, this is the change request not the comment itself. | --start-date=2025-01-01 |
| End date | The change requests created date to filter before this date, this is the change request not the comment itself. | --end-date=2025-12-31 |
| Filters | Allows passing raw filters directly to the provider's API. See your provider's API docs for available fields. For GitHub: list review comments. It will pass the filters for each change request request. | --raw-filters=sort=created |
| Force | By default a file is stored with the retrieved data to avoid refetching it again. However, using this parameter bypass this cache. | --force=true |
| Update | Incrementally fetch only comments updated since the last sync. | --update=true |
Examples - Fetch change request comments
Fetching comments for change requests created between January 1, 2025, and June 30, 2025:
smm change-requests fetch-comments --start-date=2025-01-01 --end-date=2025-06-30Forcing the fetch to ignore already fetched comments (this overrides the data stored):
smm change-requests fetch-comments --force=trueDashboard filters
Use these filters in the Change Requests dashboard tab.
Date range filters
| Dashboard filter | Backend query parameter |
|---|---|
startDate | start_date |
endDate | end_date |
timezone | timezone |
Change Requests-specific filters
| Dashboard filter | Backend query parameter |
|---|---|
authorSelect[] | authors |
excludeAuthorSelect[] | exclude_authors |
excludeCommenterSelect[] | exclude_commenters |
labelSelector[] | labels |
changeRequestStatus | status |
aggregateBy | aggregate_by |
For list filters ([]), the dashboard sends comma-separated values.
The status filter supports open, closed, merged, and draft. The aggregation filter supports day, week, and month.
The shared date picker, timezone behavior, saved views, and tab navigation are documented in Dashboard.
Statistical method, outliers and weekend filtering
Change request metrics support multiple statistical methods via the --method option:
--method average|median|p75|p90|p95|min|maxThe default is average. median (p50) shows the typical experience without being skewed by outliers. p75/p90/p95 answer "N% of change requests are within X days", matching common SLA formulations. min/max show the full range.
Average-based change request metrics can include unusually large or small samples, such as a change request left open during a holiday or a burst of automated comments. CLI commands that compute metrics expose two cleaning options:
--weekends include|exclude|weekends_only
--outlier-mode include|flag|exclude
--weekends controls the sample set before metrics are calculated. Use include to keep all samples, exclude to use weekday samples only, or weekends_only to inspect weekend activity separately.
--outlier-mode controls detected outliers. Use include to keep all samples without reporting outliers, flag to keep all samples and print outliers, or exclude to remove outliers before computing the metric. Outliers are detected with the interquartile range rule: values outside Q1 - 1.5 * IQR and Q3 + 1.5 * IQR are flagged. Weekend filtering runs before outlier detection.
These options are available on smm change-requests review-time, smm change-requests open-time, and smm change-requests comments.
Dashboard cards
The Change Requests tab includes:
- Average Review Time: review time grouped by author.
- Who Comments The Most: comment volume by commenter (dashboard only).
- Time To First Comment: elapsed time until the first change request comment (dashboard only).
- Change Requests by Author: number of change requests opened by author.
- Most Commented Change Requests: change requests with the most discussion, with direct links (dashboard only).
- Top Themes in Comments: common terms in change request comments, with links to search for each theme (dashboard only).
- Open Change Requests Through Time: opened and closed change request volume over time.
- Average Days Change Requests Remain Open: trend of how long change requests stay open.
- Change Request Statistics: totals, status counts, label distribution, and summary details.
Statistics and label values link to provider change request pages when the configured provider supports those URLs. Cards marked dashboard only are computed on the fly from comment data and do not have separate CLI commands; run smm change-requests fetch-comments first to populate the data they depend on.
Summary change request data
Show a summary of the change requests fetched from the repository, including total change requests, average open time, and other key metrics.
Available as the Change Request Statistics card in the Change Requests tab and as the Change Requests summary card in the Insights tab.
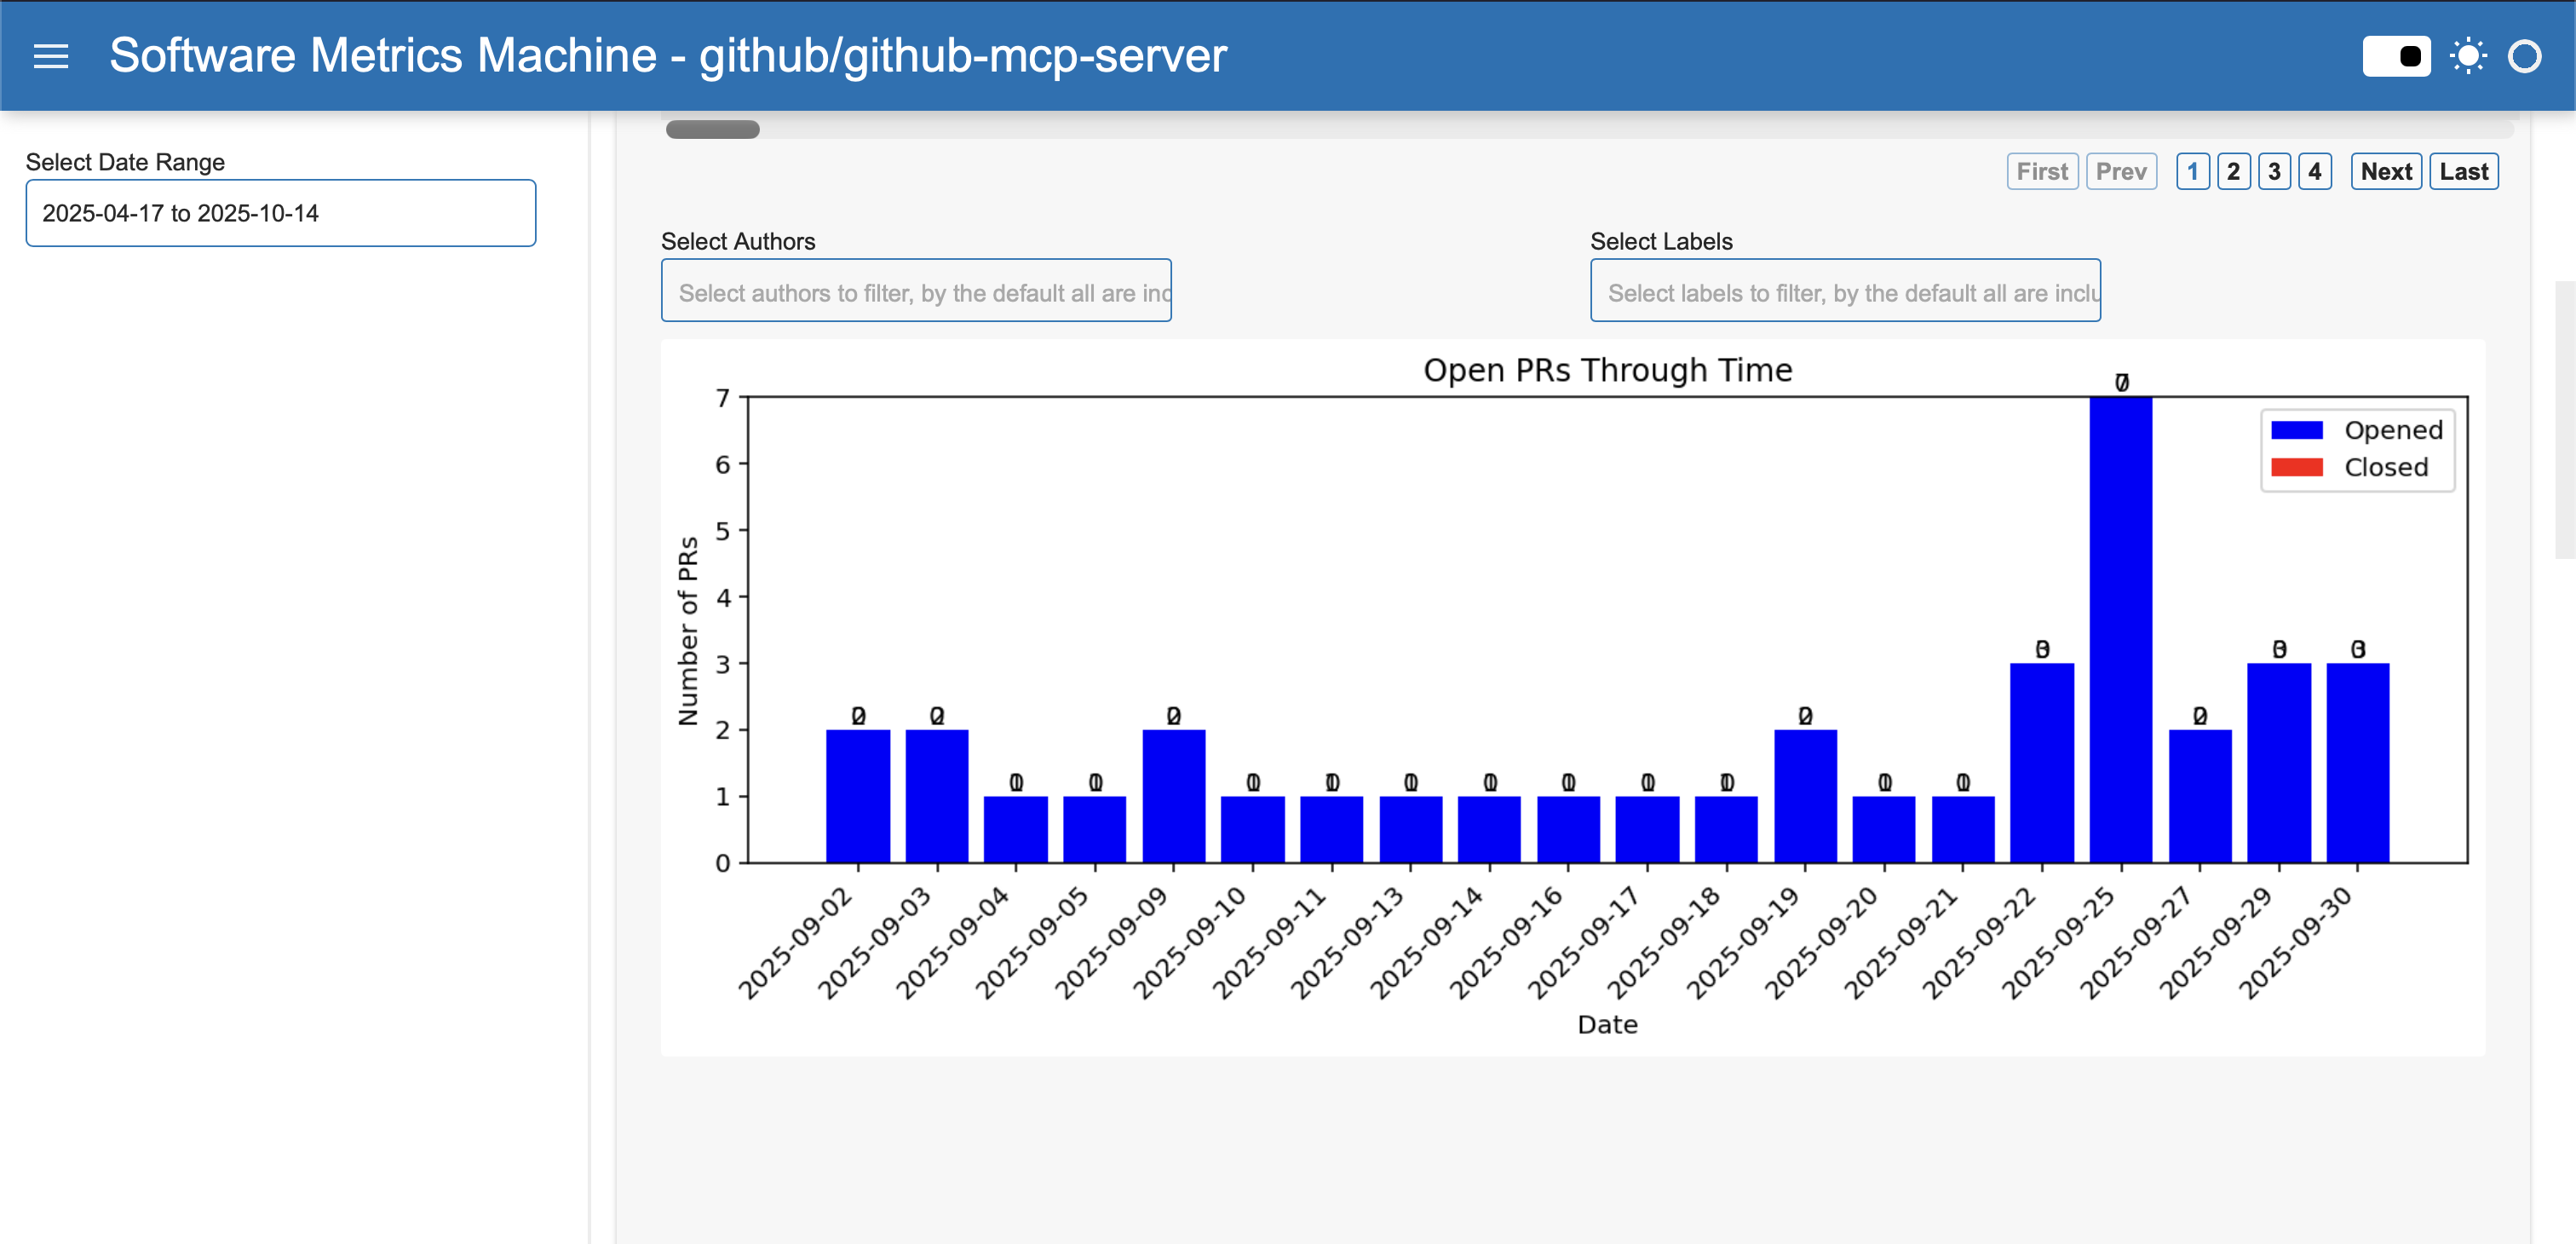
Open Change Requests Through Time
Shows the volume of change requests opened and closed each day. This helps you spot bottlenecks, busy periods, or trends in your team's workflow.
Type of Chart
Bar chart (daily breakdown, with separate bars for opened and closed change requests).
Insight Provided
Shows the volume of change requests opened and closed each day. This helps you spot bottlenecks, busy periods, or trends in your team's workflow.
How It Computes and Filters
- Aggregates change request events by day.
- Filters by date range (start/end date) - the date used in the change requests are the created_at.
- Data is processed to count opened and closed change requests per day.
- You can filter the chart to focus on specific periods, such as a sprint or release window.
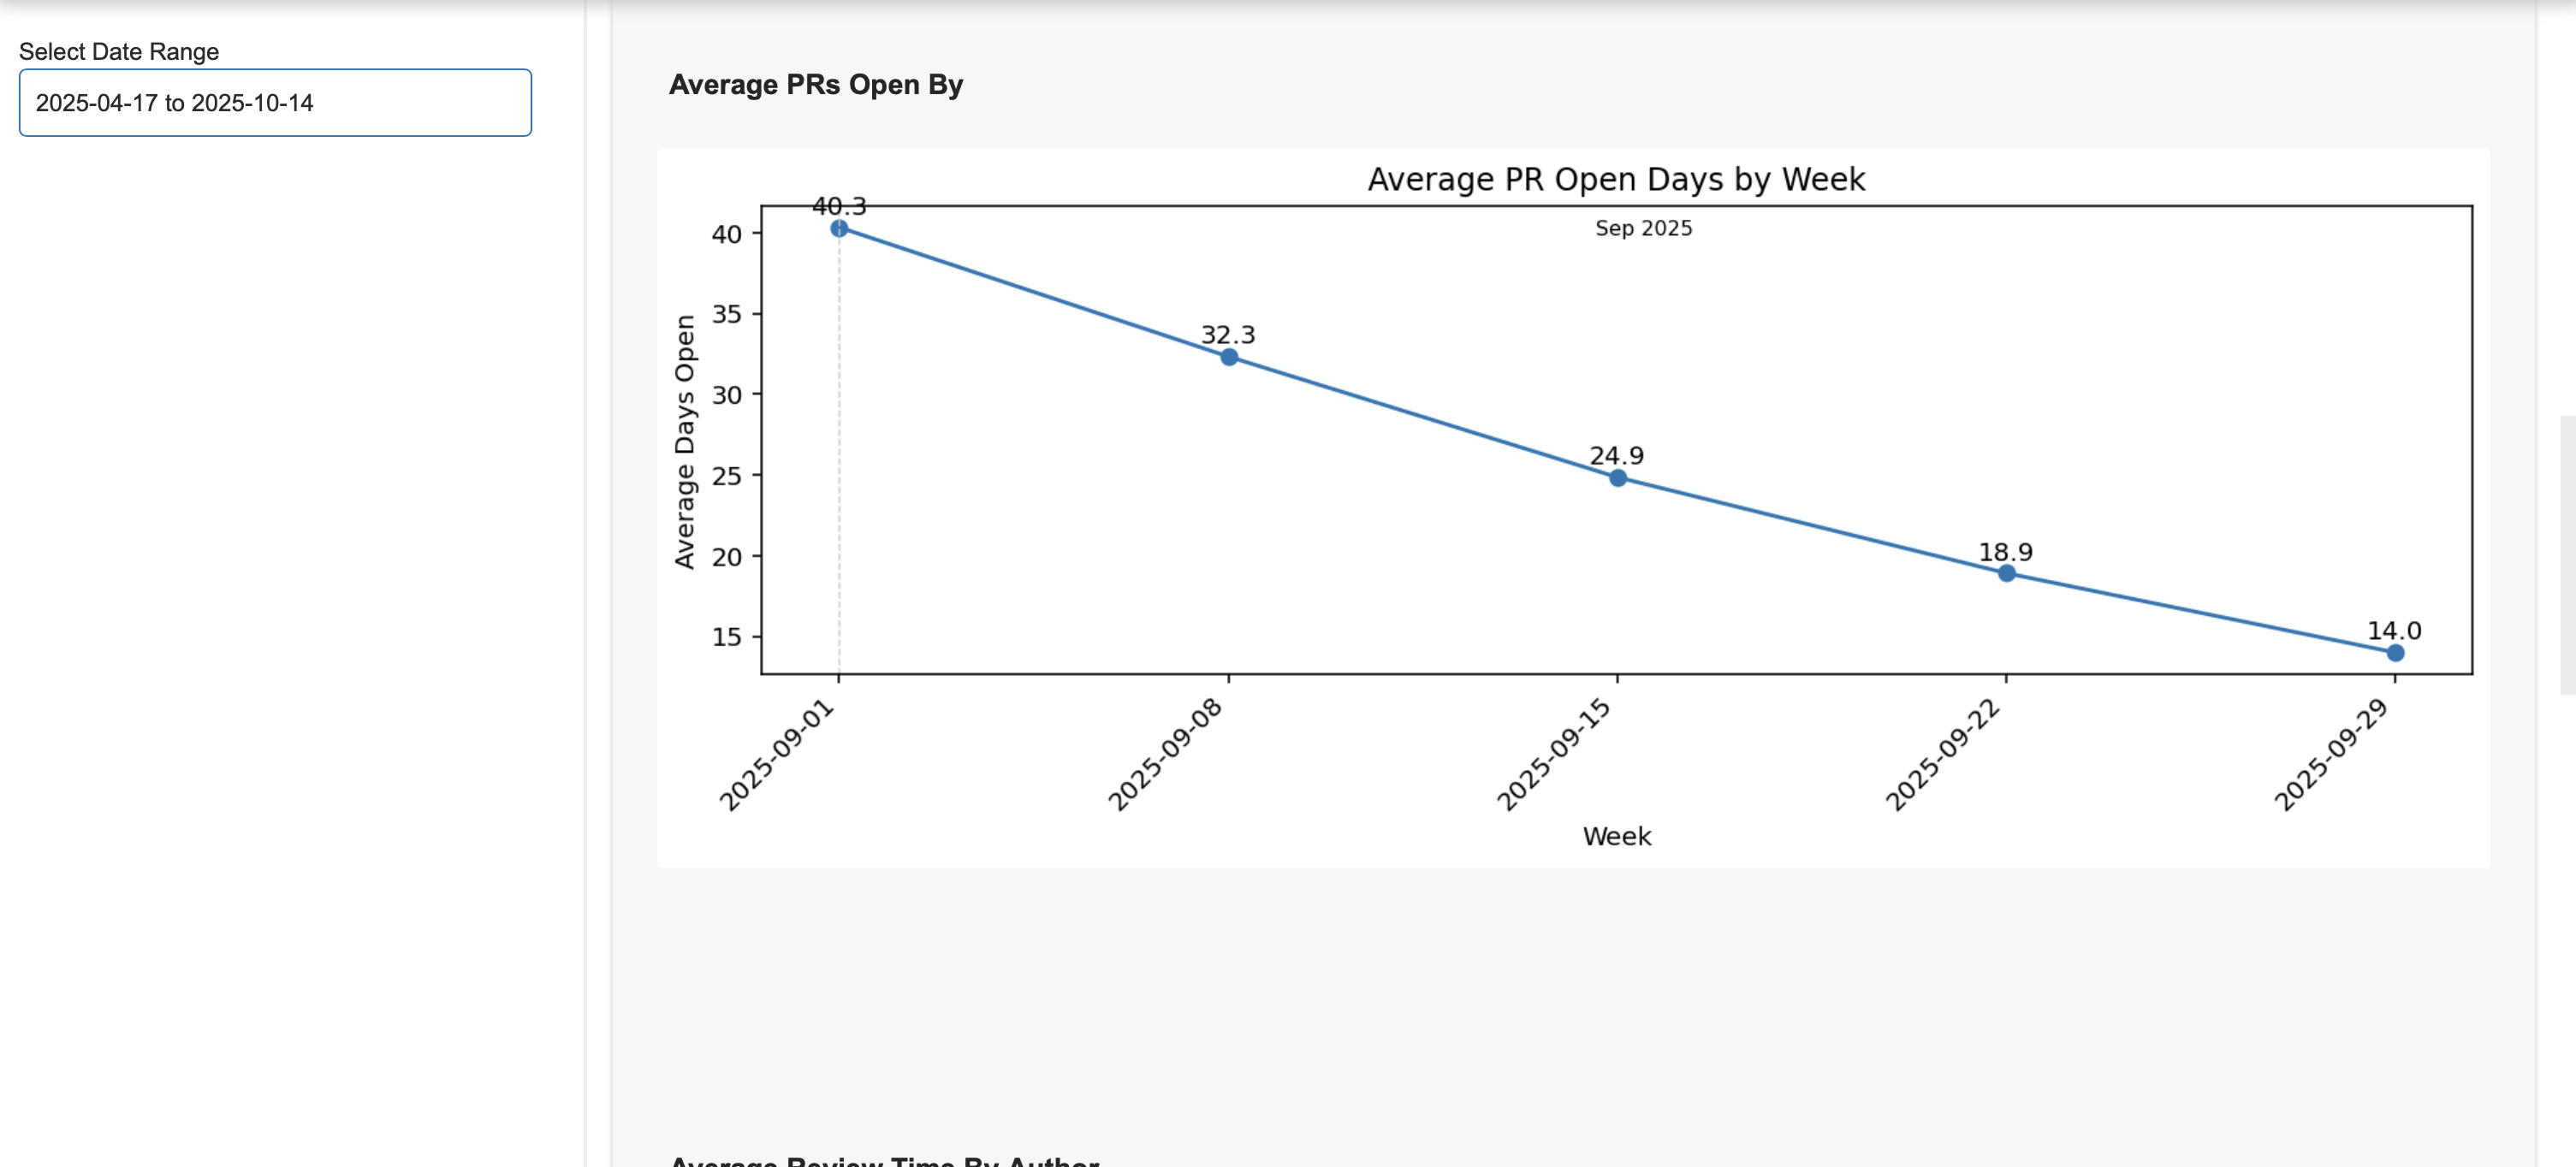
Change Request Open Time
Tracks how long change requests stay open before merging. It uses weekly or monthly aggregation to show trends in review speed.
Type of Chart
Line chart showing the trend of average days change requests remain open, aggregated by week or month to smooth daily fluctuations.
Insight Provided
Reveals how quickly your team merges change requests and whether review speed is improving or degrading over time. A downward trend suggests faster reviews and healthier flow.
How It Computes and Filters
- Calculates the average number of days change requests are open, grouped by week or month.
- Supports filters for author, labels (e.g., bug, enhancement), and date range.
- Aggregation smooths out daily fluctuations, showing long-term trends.
Review Time By Author
Plot the review time taken from the team to review a change request opened by an author and merge it. Supports multiple statistical methods via --method.
Example Usage
If one author consistently has longer open times, it may indicate complex change requests or a need for more review support. For example, if Alice's change requests average 7 days open while others average 2, you can investigate further.
How It Computes and Filters
- Computes average open time for each author.
- Filters by top N authors, labels, and date range.
- Data is processed to exclude bots or focus on specific contributors.
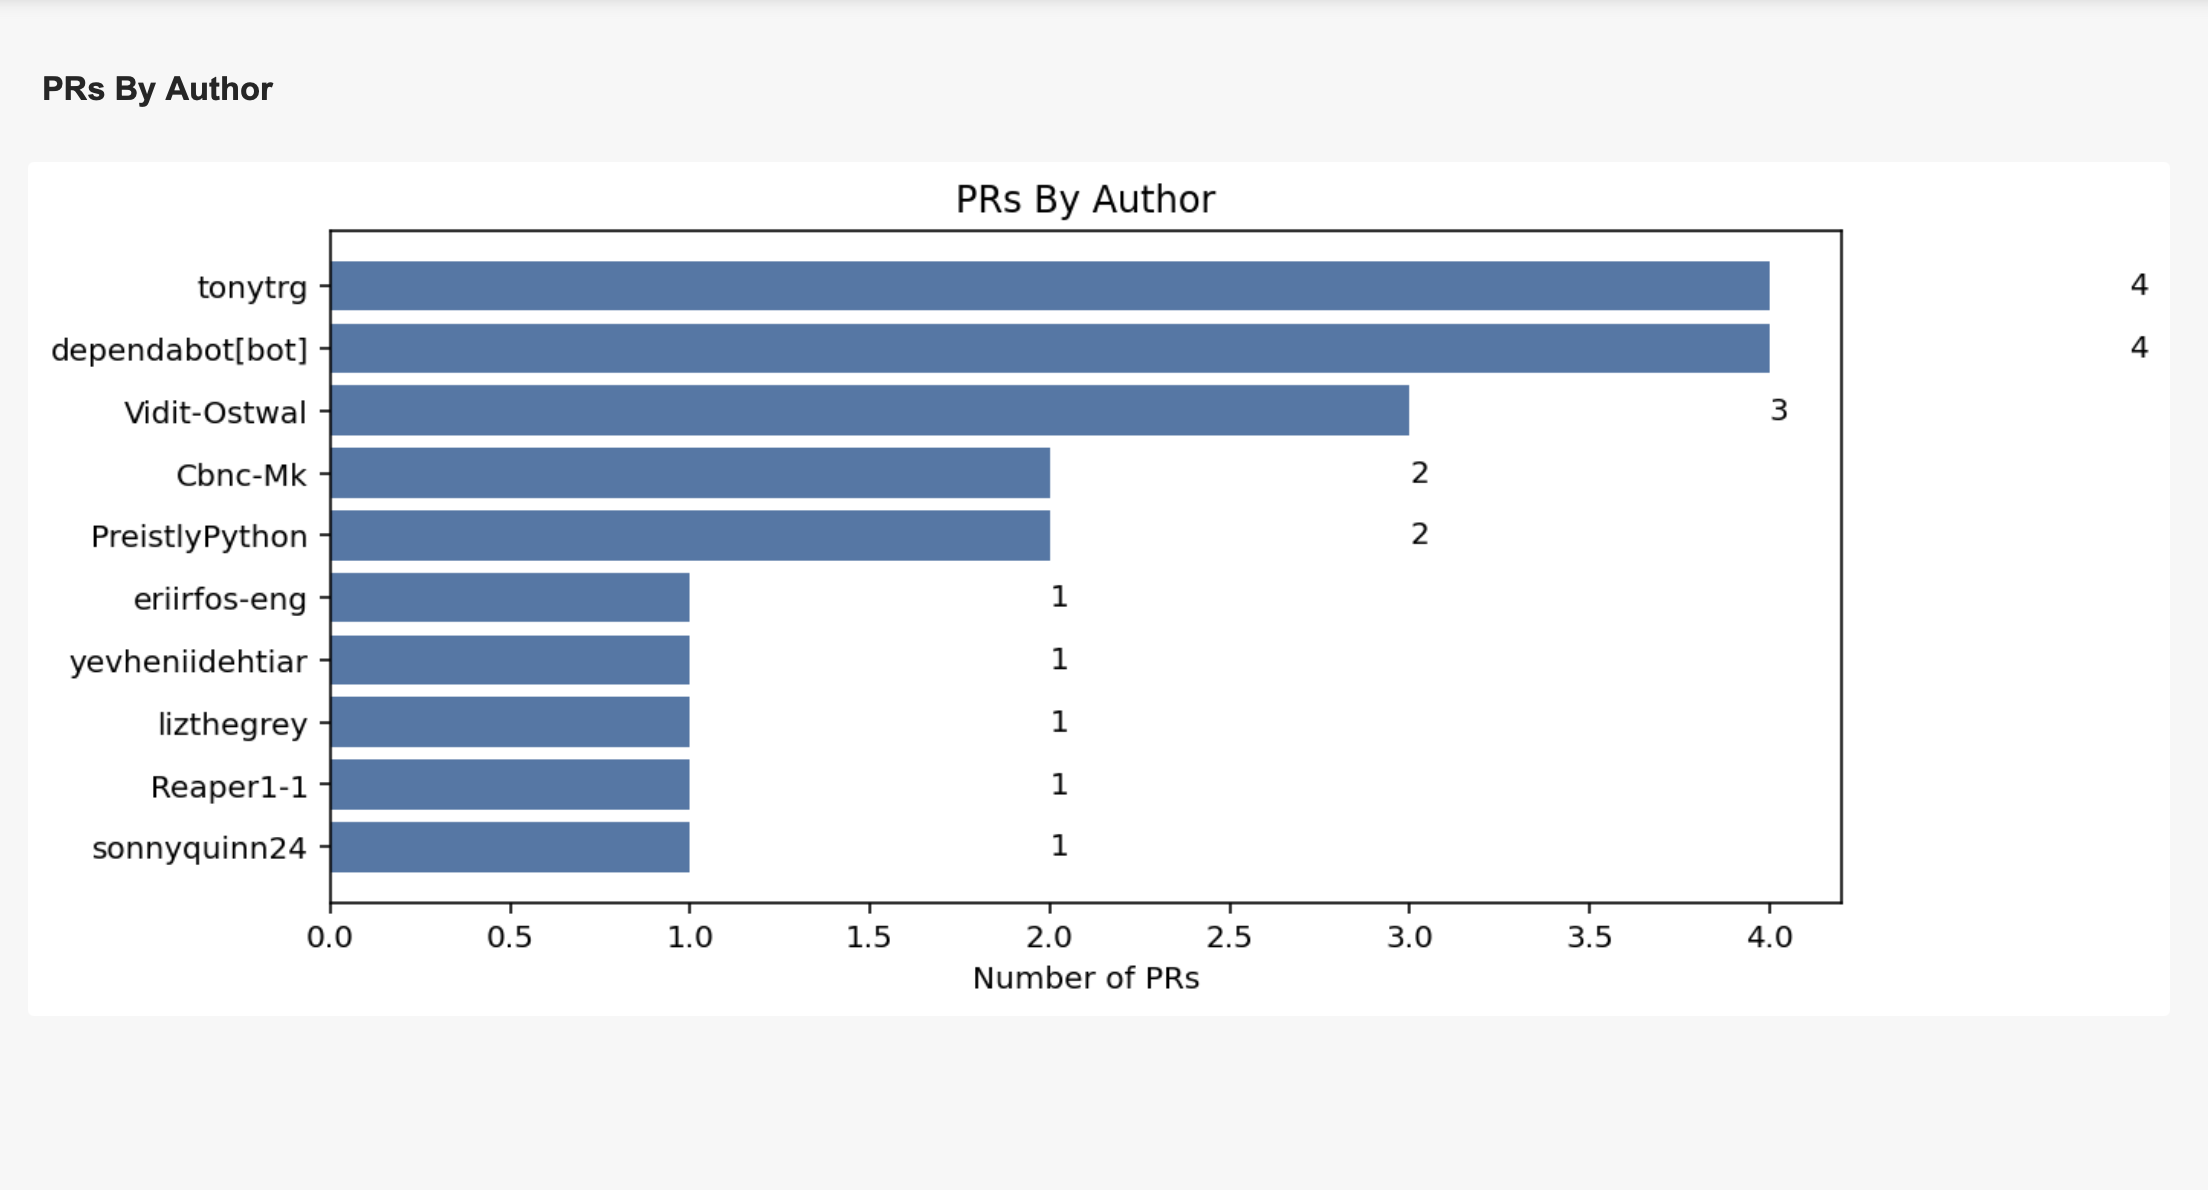
Change Requests By Author
Example Usage
If one developer is opening most change requests, you may want to redistribute tasks or recognize their effort. For example, if Bob opened 30 change requests in a month, he's a key contributor.
How It Computes and Filters
- Counts change requests opened by each author.
- Filters by top N authors, labels, and date range.
- Includes bots (e.g., dependabot) to show the impact of automation.
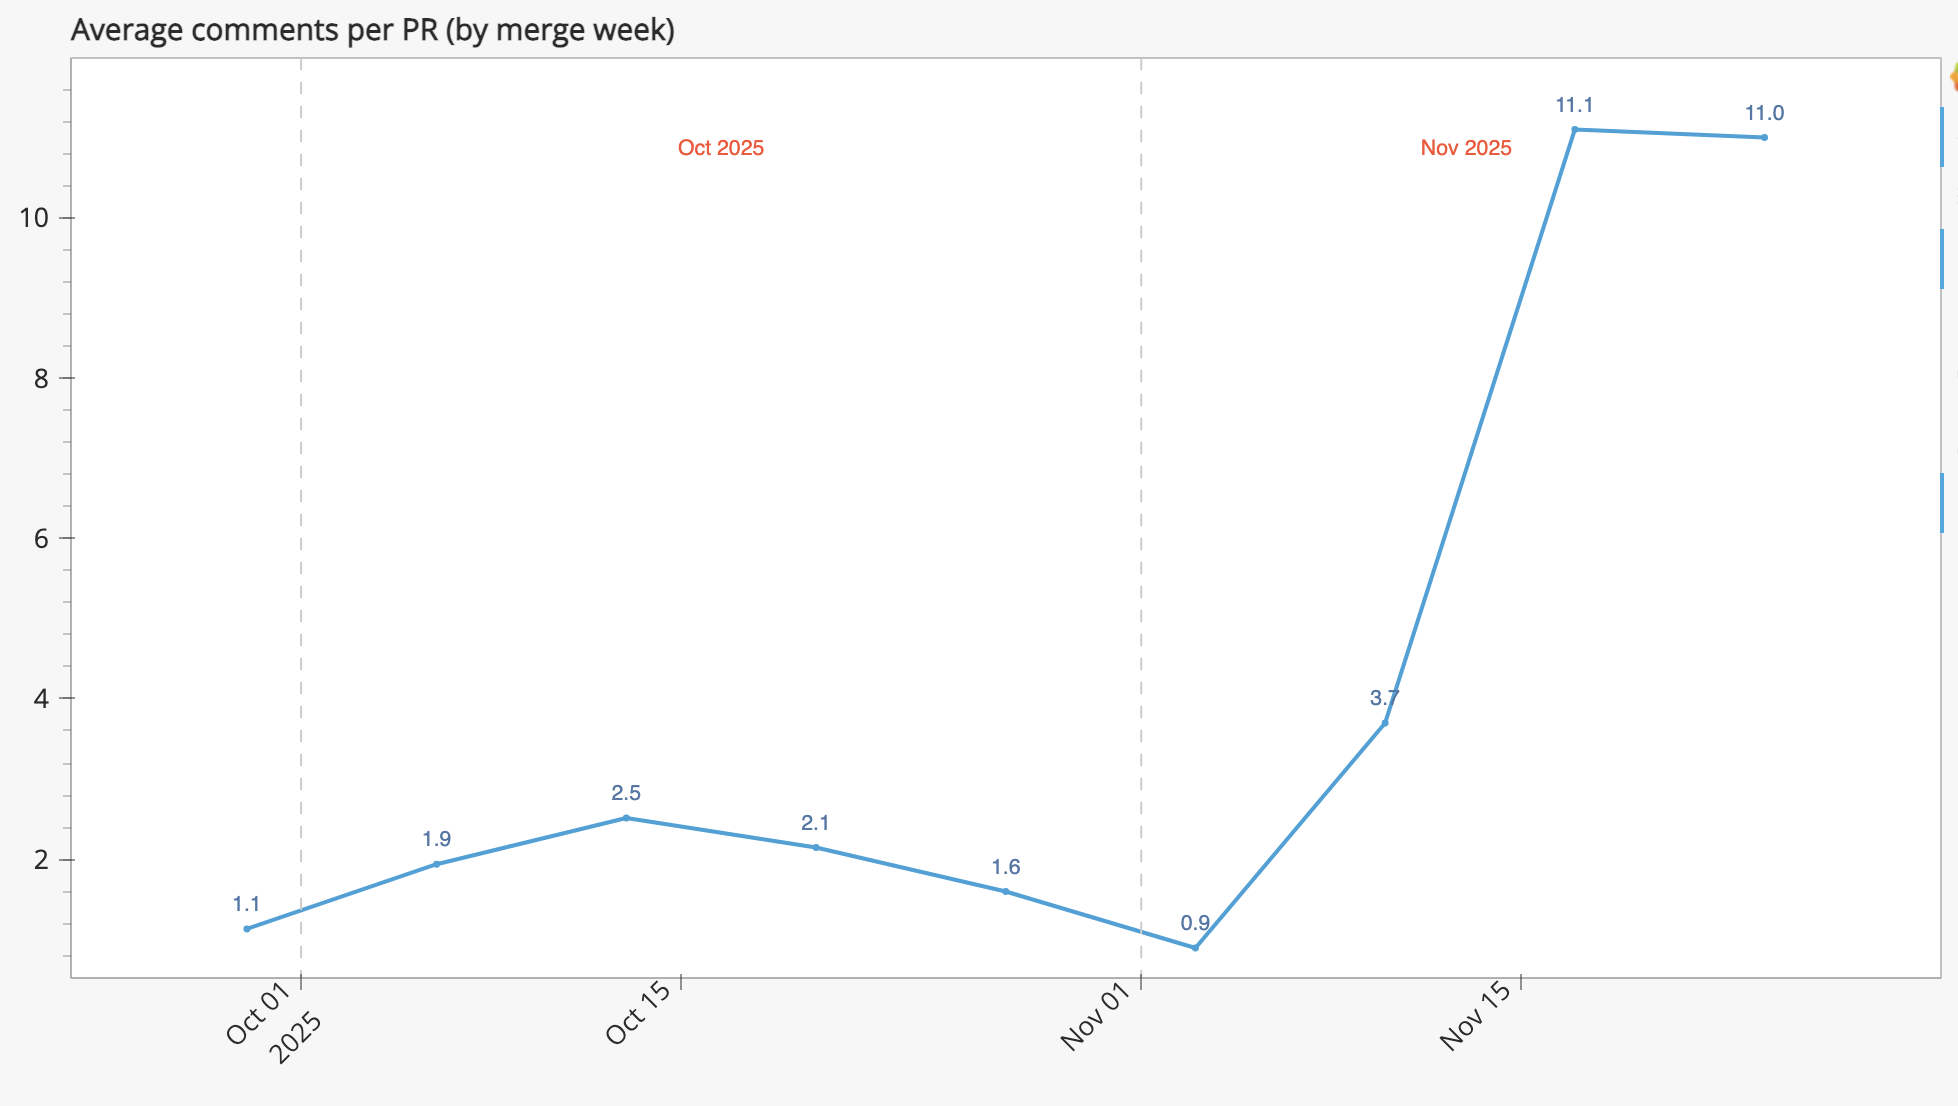
Comments per change request
Plot the number of comments a change request receives before it is merged, aggregated by week or month. Supports multiple statistical methods via --method.
Type of Chart
Line chart showing the average number of comments per change request over time, aggregated by week or month.
Insight Provided
Measures discussion depth on change requests. Higher values may indicate thorough reviews or contentious changes, while very low values could signal superficial reviews.