Source code
Works with:
GitHubGitLabBitbucketany git based repositoryThe Code Metrics Dashboard provides a comprehensive overview of your project's source code health and evolution. Designed for software developers and team leads, this section offers actionable insights into code quality, complexity, and change patterns. By visualizing key metrics, the dashboard helps you identify areas for refactoring, monitor technical debt, and track the impact of development practices over time.
The Source Code dashboard tab includes:
- Big O Classification.
- Code Churn Over Time.
- Top pairings and latest paired commits.
- Entity Churn.
- Entity Effort chart and treemap.
- Ownership by author, file, and entity.
- Code Coupling.
Fetching data
Fetching the data before operating it is the first step to get started with metrics. Code metrics are extracted from the local git repository using Codemaat — the repository must be cloned locally for the analysis to work.
Date-only values passed to --start-date and --end-date are interpreted with the selected project's configured timezone from smm_config.json. If the project does not set timezone, SMM uses the project-specific SMM_TIMEZONE environment variable, then UTC.
smm code codemaat-fetch --start-date 2025-01-01 --end-date 2025-12-31| Option | Description | Example |
|---|---|---|
| Start date | Start date for git history extraction (required). | --start-date=2025-01-01 |
| End date | End date for git history extraction (required). | --end-date=2025-12-31 |
| Subfolder | Subfolder within the repository to analyze. | --subfolder=src |
| Group depth | Directory depth used to auto-generate CodeMaat grouping layers. | --group-depth=2 |
| Min revs | Minimum number of revisions to include in a coupling analysis (default: 5). | --min-revs=10 |
| Min shared revs | Minimum number of shared revisions for coupling analysis (default: 5). | --min-shared-revs=10 |
| Min coupling | Minimum coupling threshold in percentage (default: 30). | --min-coupling=50 |
| Force | Force regeneration of CodeMaat CSV files, bypassing the cache. | --force |
| Output | Output format for the fetch result (text or json). | --output=json |
Examples - Fetch code metrics
Fetching git history for a specific subfolder over the last 6 months:
smm code codemaat-fetch --start-date 2025-01-01 --end-date 2025-06-30 --subfolder=srcSetting coupling thresholds for a more focused analysis:
smm code codemaat-fetch --start-date 2025-01-01 --end-date 2025-06-30 --min-coupling=50 --min-revs=10Using a temporary timezone for CLI execution:
YOUR_ORG_FRONTEND_APP_SMM_TIMEZONE=Europe/Madrid smm --project your-org/frontend-app code codemaat-fetch --start-date=2025-01-01 --end-date=2025-06-30Forcing a fresh fetch and outputting the result as JSON:
smm code codemaat-fetch --start-date 2025-01-01 --end-date 2025-06-30 --force --output=jsonFetch commits
The fetch-commits command extracts commits from the local git repository for change set analysis. Unlike codemaat-fetch, this command focuses on raw commit data rather than CodeMaat-processed metrics.
Date-only values passed to --start-date and --end-date are interpreted with the selected project's configured timezone from smm_config.json. If the project does not set timezone, SMM uses the project-specific SMM_TIMEZONE environment variable, then UTC.
smm code fetch-commits --start-date 2025-01-01 --end-date 2025-06-30| Option | Description | Example |
|---|---|---|
| Start date | Start date for commit extraction. | --start-date=2025-01-01 |
| End date | End date for commit extraction. | --end-date=2025-06-30 |
| Authors | Comma-separated list of authors to filter. | --authors="Alice,Bob" |
| Force | Force refetch commits from git, bypassing the cache. | --force |
| Buffer | Max buffer size in MB for git output (default: 100). | --buffer=200 |
| Output | Output format for the result (text or json). | --output=json |
Examples - Fetch commits
Fetch commits filtered by author:
smm code fetch-commits --start-date 2025-01-01 --end-date 2025-06-30 --authors="Alice,Bob"Force a fresh fetch and output as JSON:
smm code fetch-commits --start-date 2025-01-01 --end-date 2025-06-30 --force --output=jsonIncrease the buffer size for repositories with large commit histories:
smm code fetch-commits --start-date 2025-01-01 --end-date 2025-12-31 --buffer=500Code churn
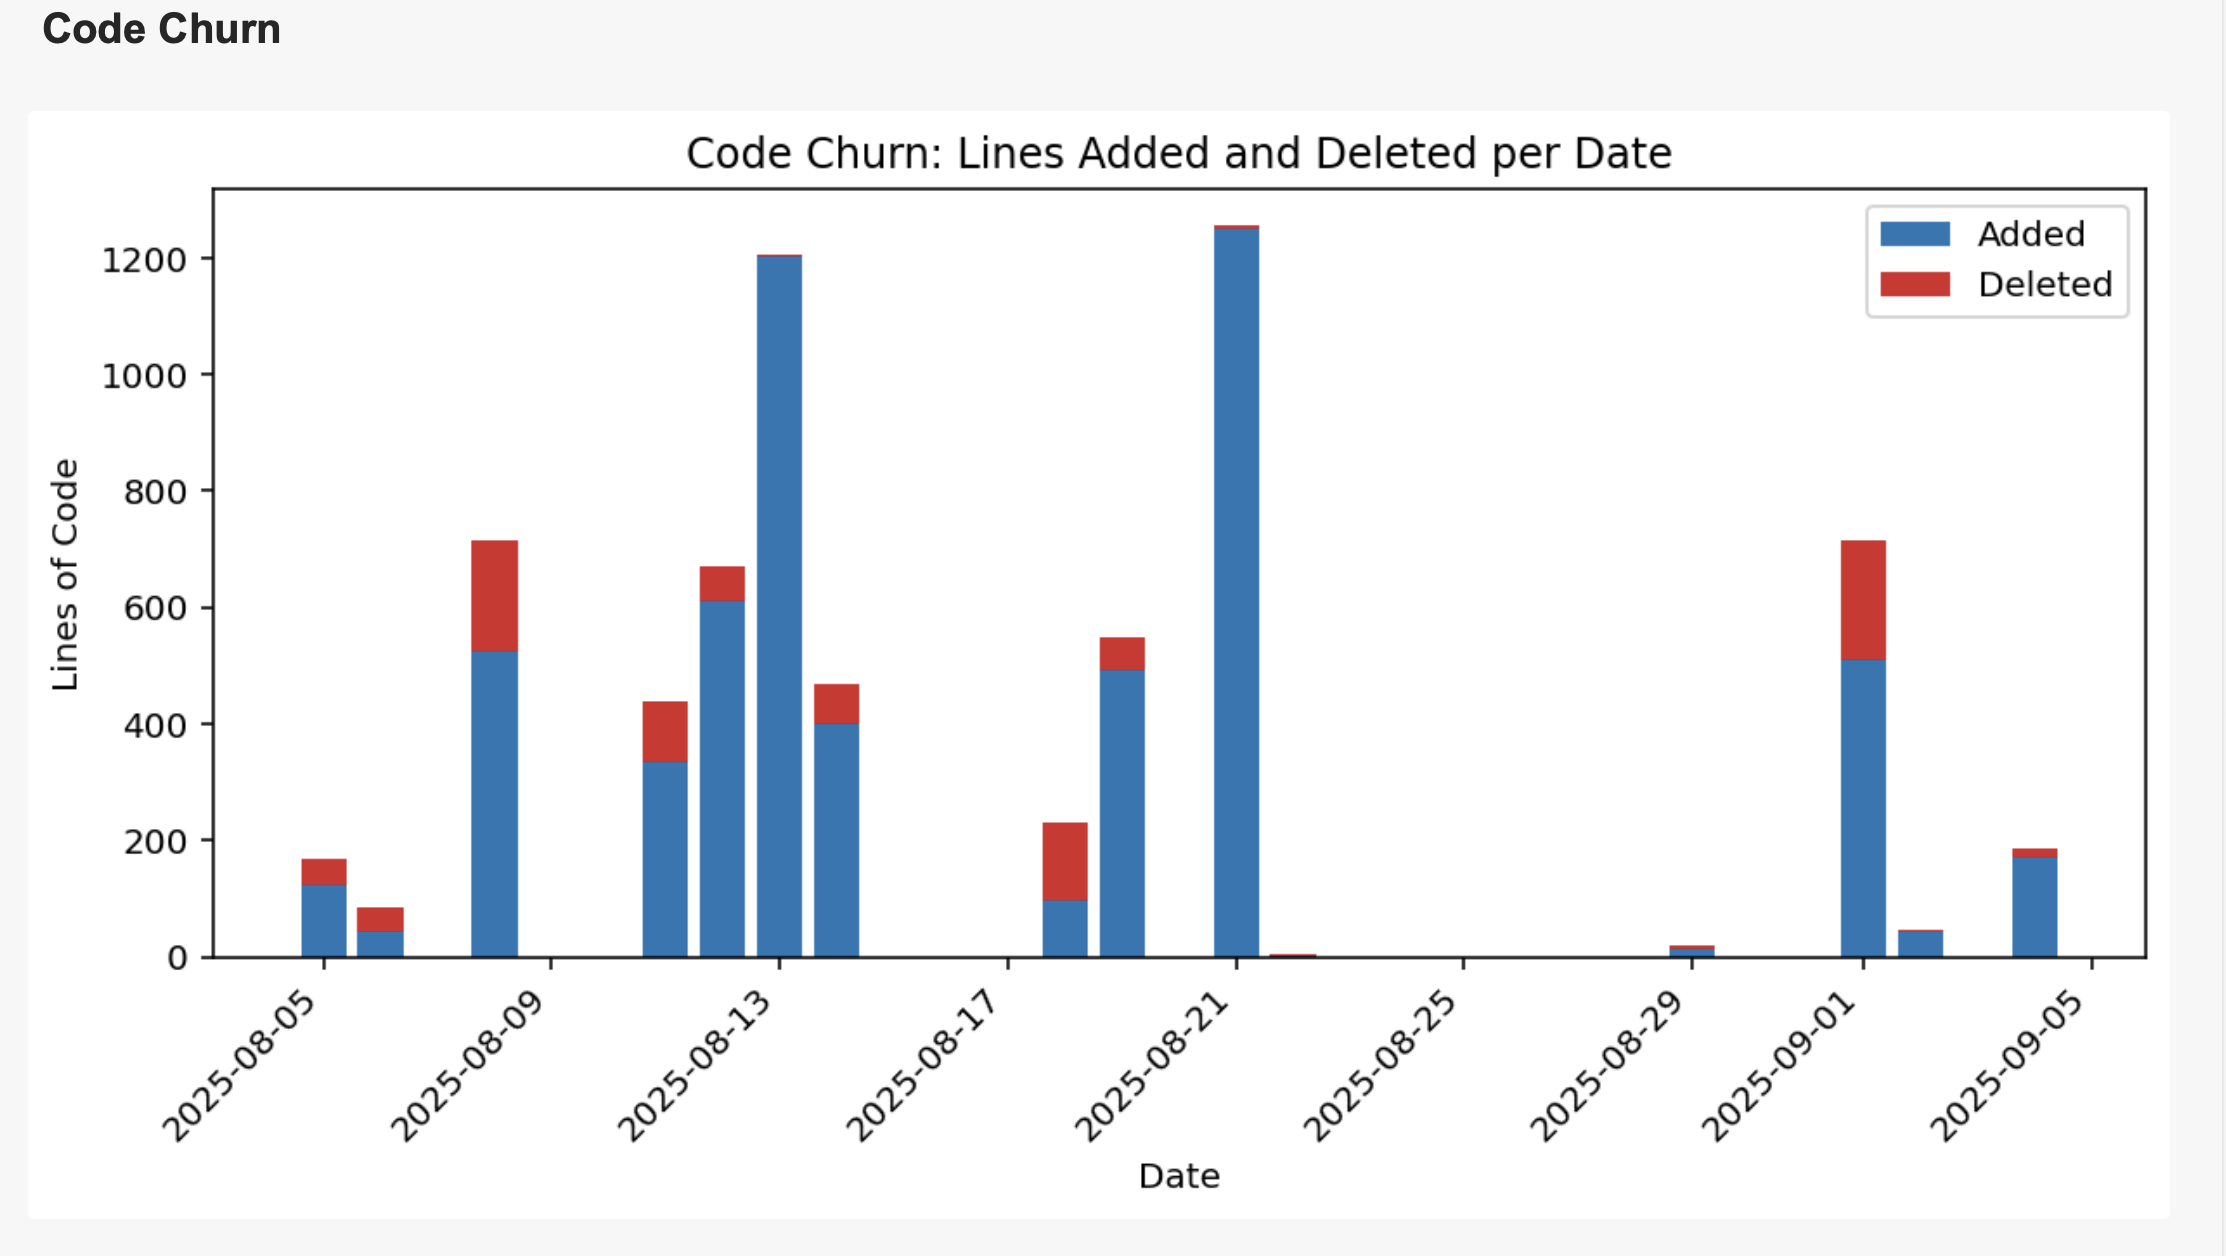
A stacked bar chart showing the total number of lines added (blue) and deleted (red) across the entire repository on a given date.
Type of Chart
Stacked bar chart showing lines added (blue) and deleted (red) per day.
Insight Provided
Reveals the rhythm of development activity, highlighting periods of intense work, refactoring, or inactivity. It helps you spot major events and understand the overall pace of your team's coding efforts.
Example Usage
Use this chart to identify when large features were merged, when refactoring happened, or to monitor the impact of sprints. For example, a spike in both additions and deletions may indicate a major refactor.
How It Computes and Filters
Aggregates commit data by day, counting lines added and deleted. You can filter by date range and interact with the chart to see which commits contributed to the churn on a specific day.
Entity Churn
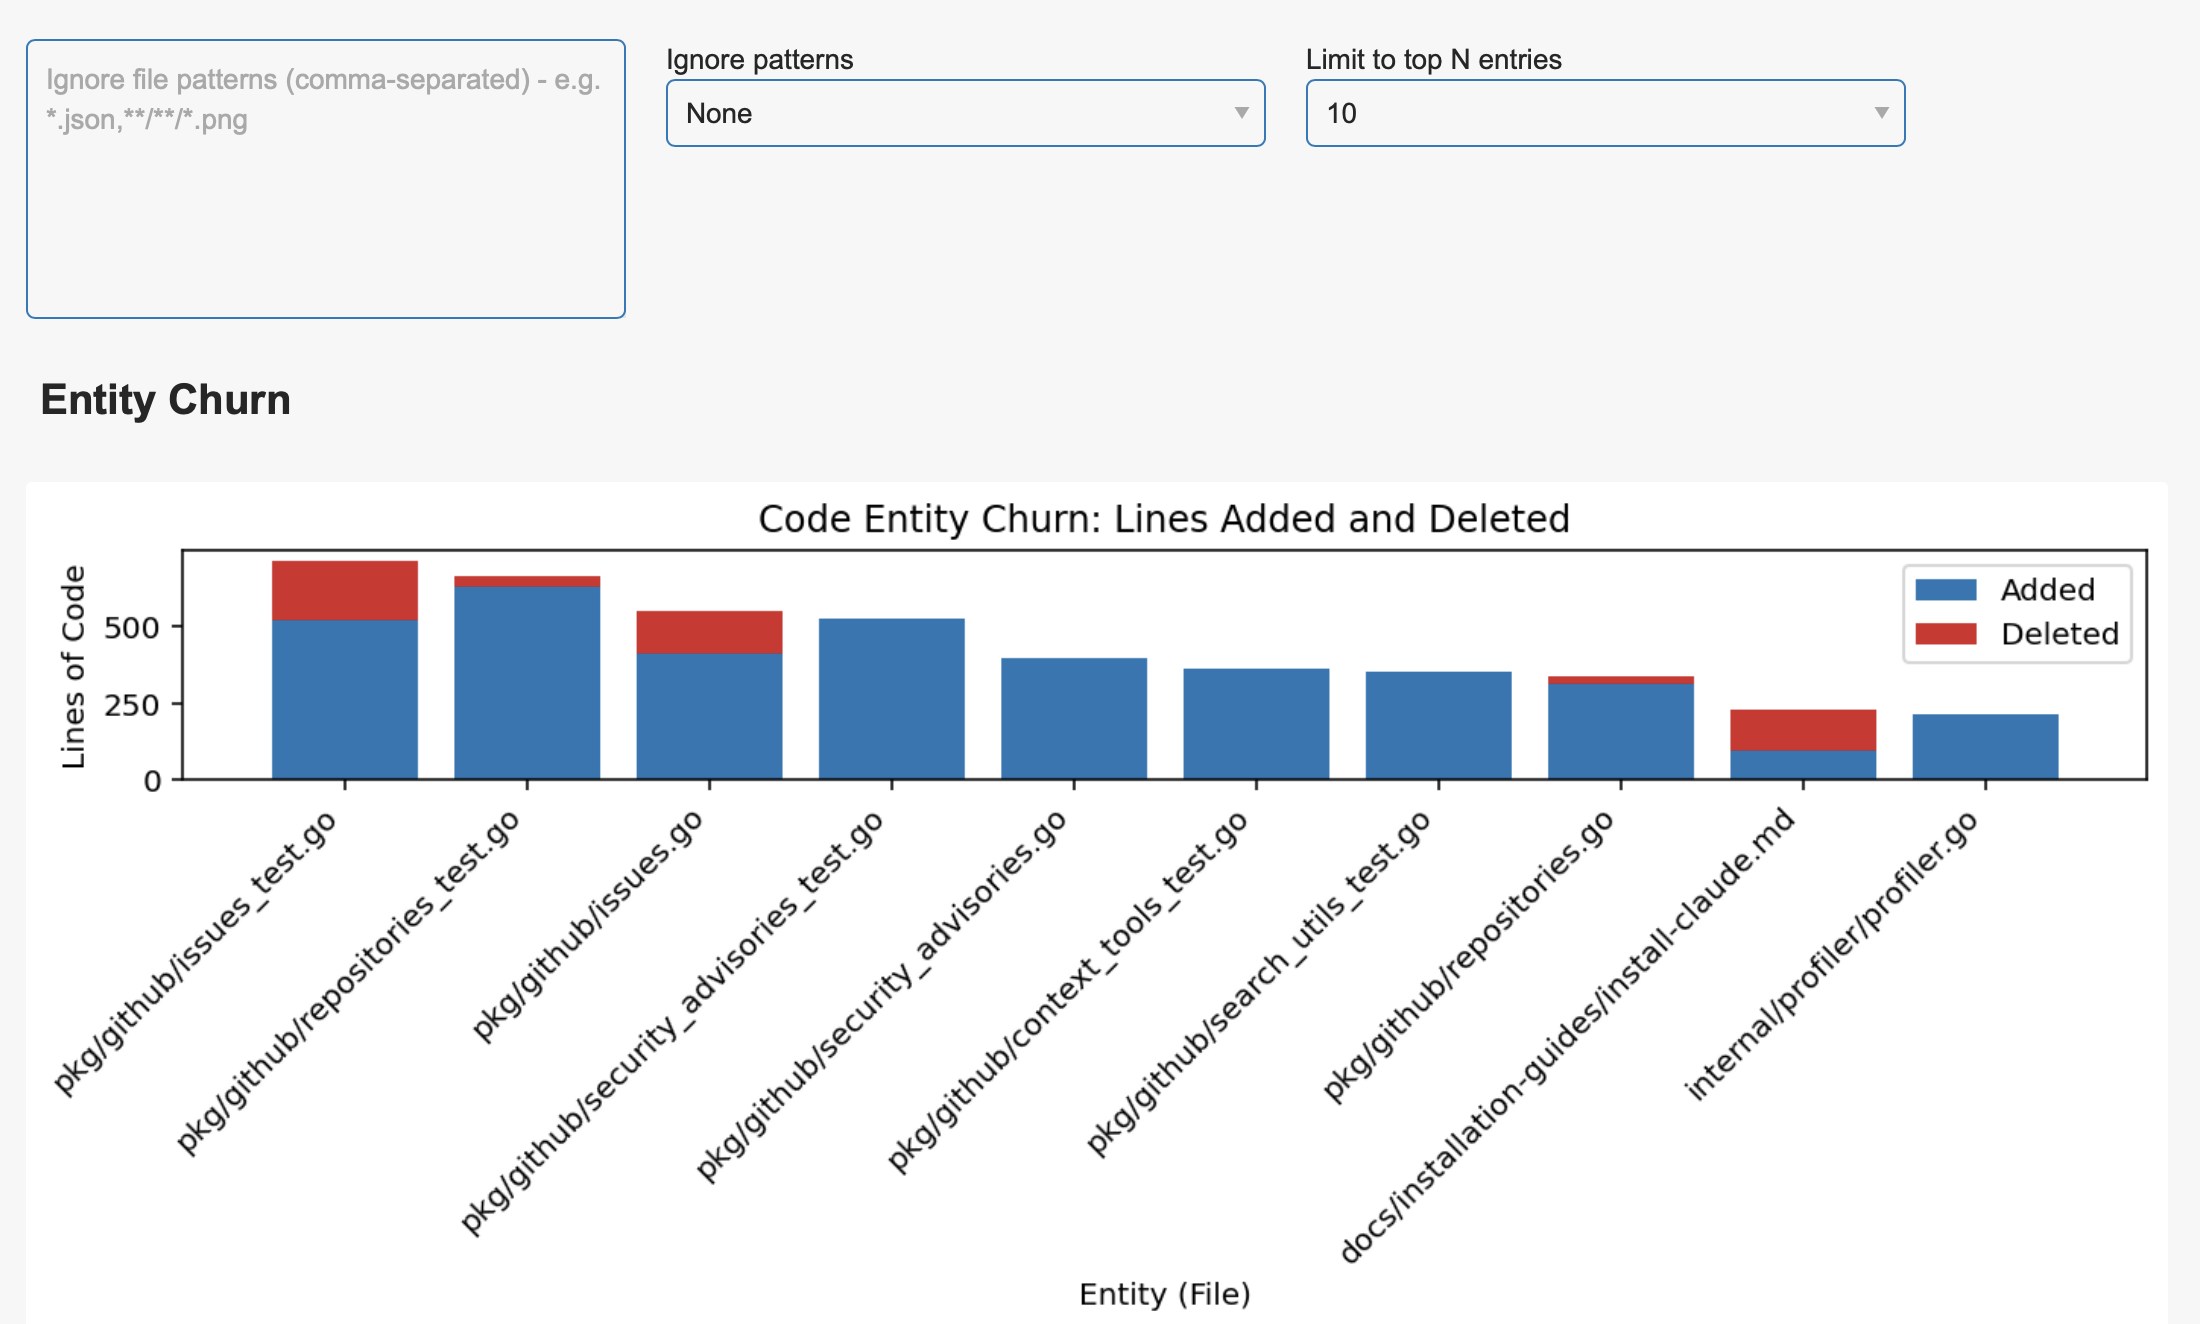
Entity churn reveals which files in your project are changed most often. This chart helps you pinpoint hotspots—files that may need refactoring, more tests, or architectural review. With powerful filtering options, you can exclude generated files or focus on the top N most frequently changed files. This makes it easy to find areas of your codebase that require attention and improvement.
Type of Chart
Bar chart showing code churn by file, focusing on the top N most frequently changed files.
Insight Provided
Pinpoints hotspots in your codebase—files that are changed most often. This helps you identify candidates for refactoring, more tests, or architectural review.
Example Usage
Use this chart to find files that are frequently modified, which may need attention. For example, if a configuration file is always changing, it might be a source of bugs or instability.
How It Computes and Filters
Counts lines added and deleted per file, then ranks files by total churn. Filtering options let you exclude generated files, vendor directories, or focus on the top N entries for meaningful insights.
Entity Effort
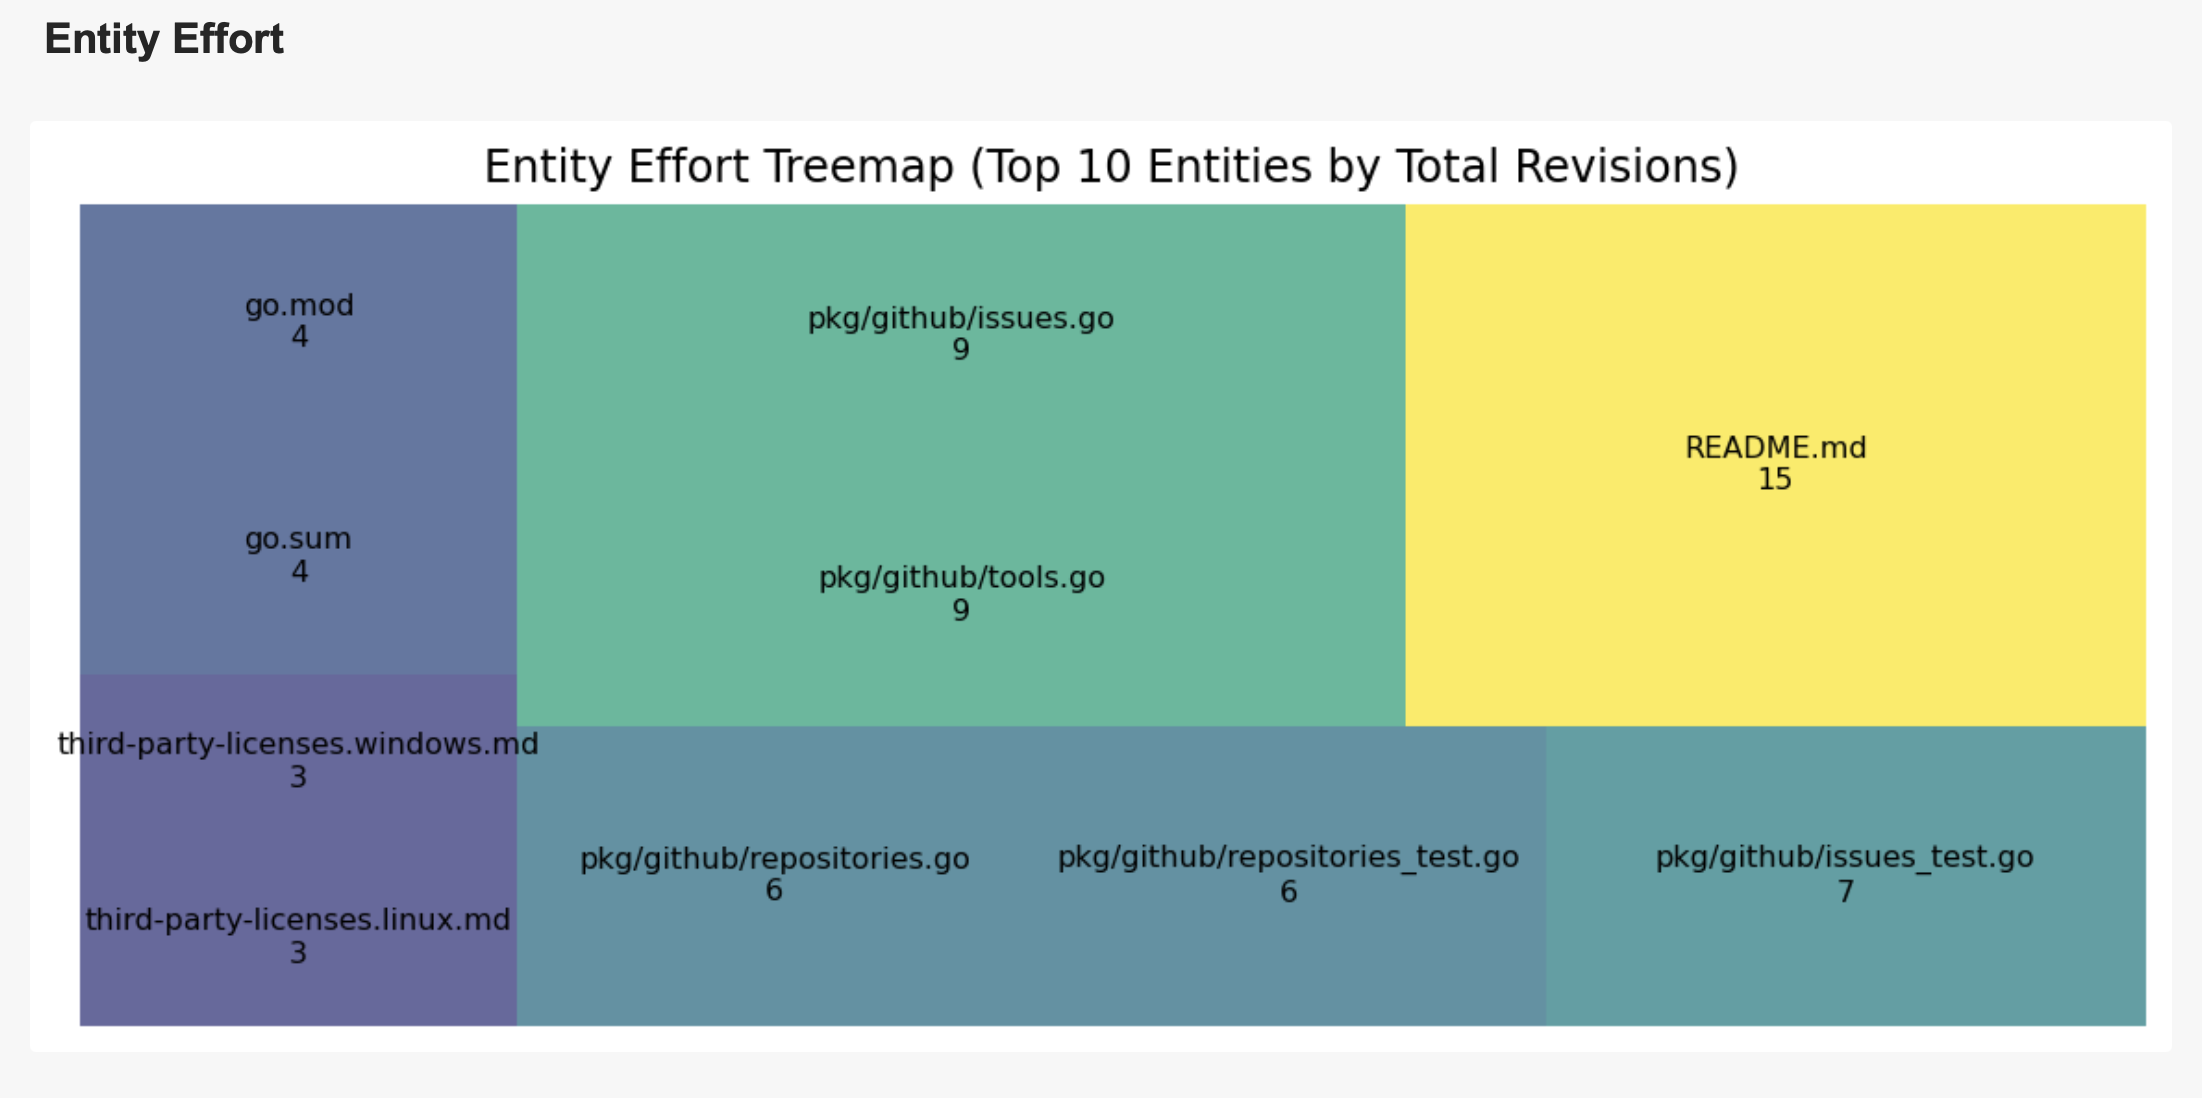
The entity effort chart shows how much work has gone into each file, measured by the number of commits. This visualization helps you understand which files are under constant development and which are more stable. Use this chart to identify files that may be over-engineered, need simplification, or are critical to your project’s success. The treemap format makes it easy to see the distribution of effort at a glance.
Type of Chart
Treemap where each rectangle's size represents the number of commits for a file.
Insight Provided
Shows which files require the most effort and attention, helping you spot files under constant development or those that are more stable.
Example Usage
Use this chart to identify files that are frequently updated, which may be critical or over-engineered. For example, a README.md with many revisions may indicate evolving documentation needs.
How It Computes and Filters
Counts the number of commits per file and visualizes the distribution. You can filter by file type or directory to focus on specific areas of your codebase.
Entity Ownership
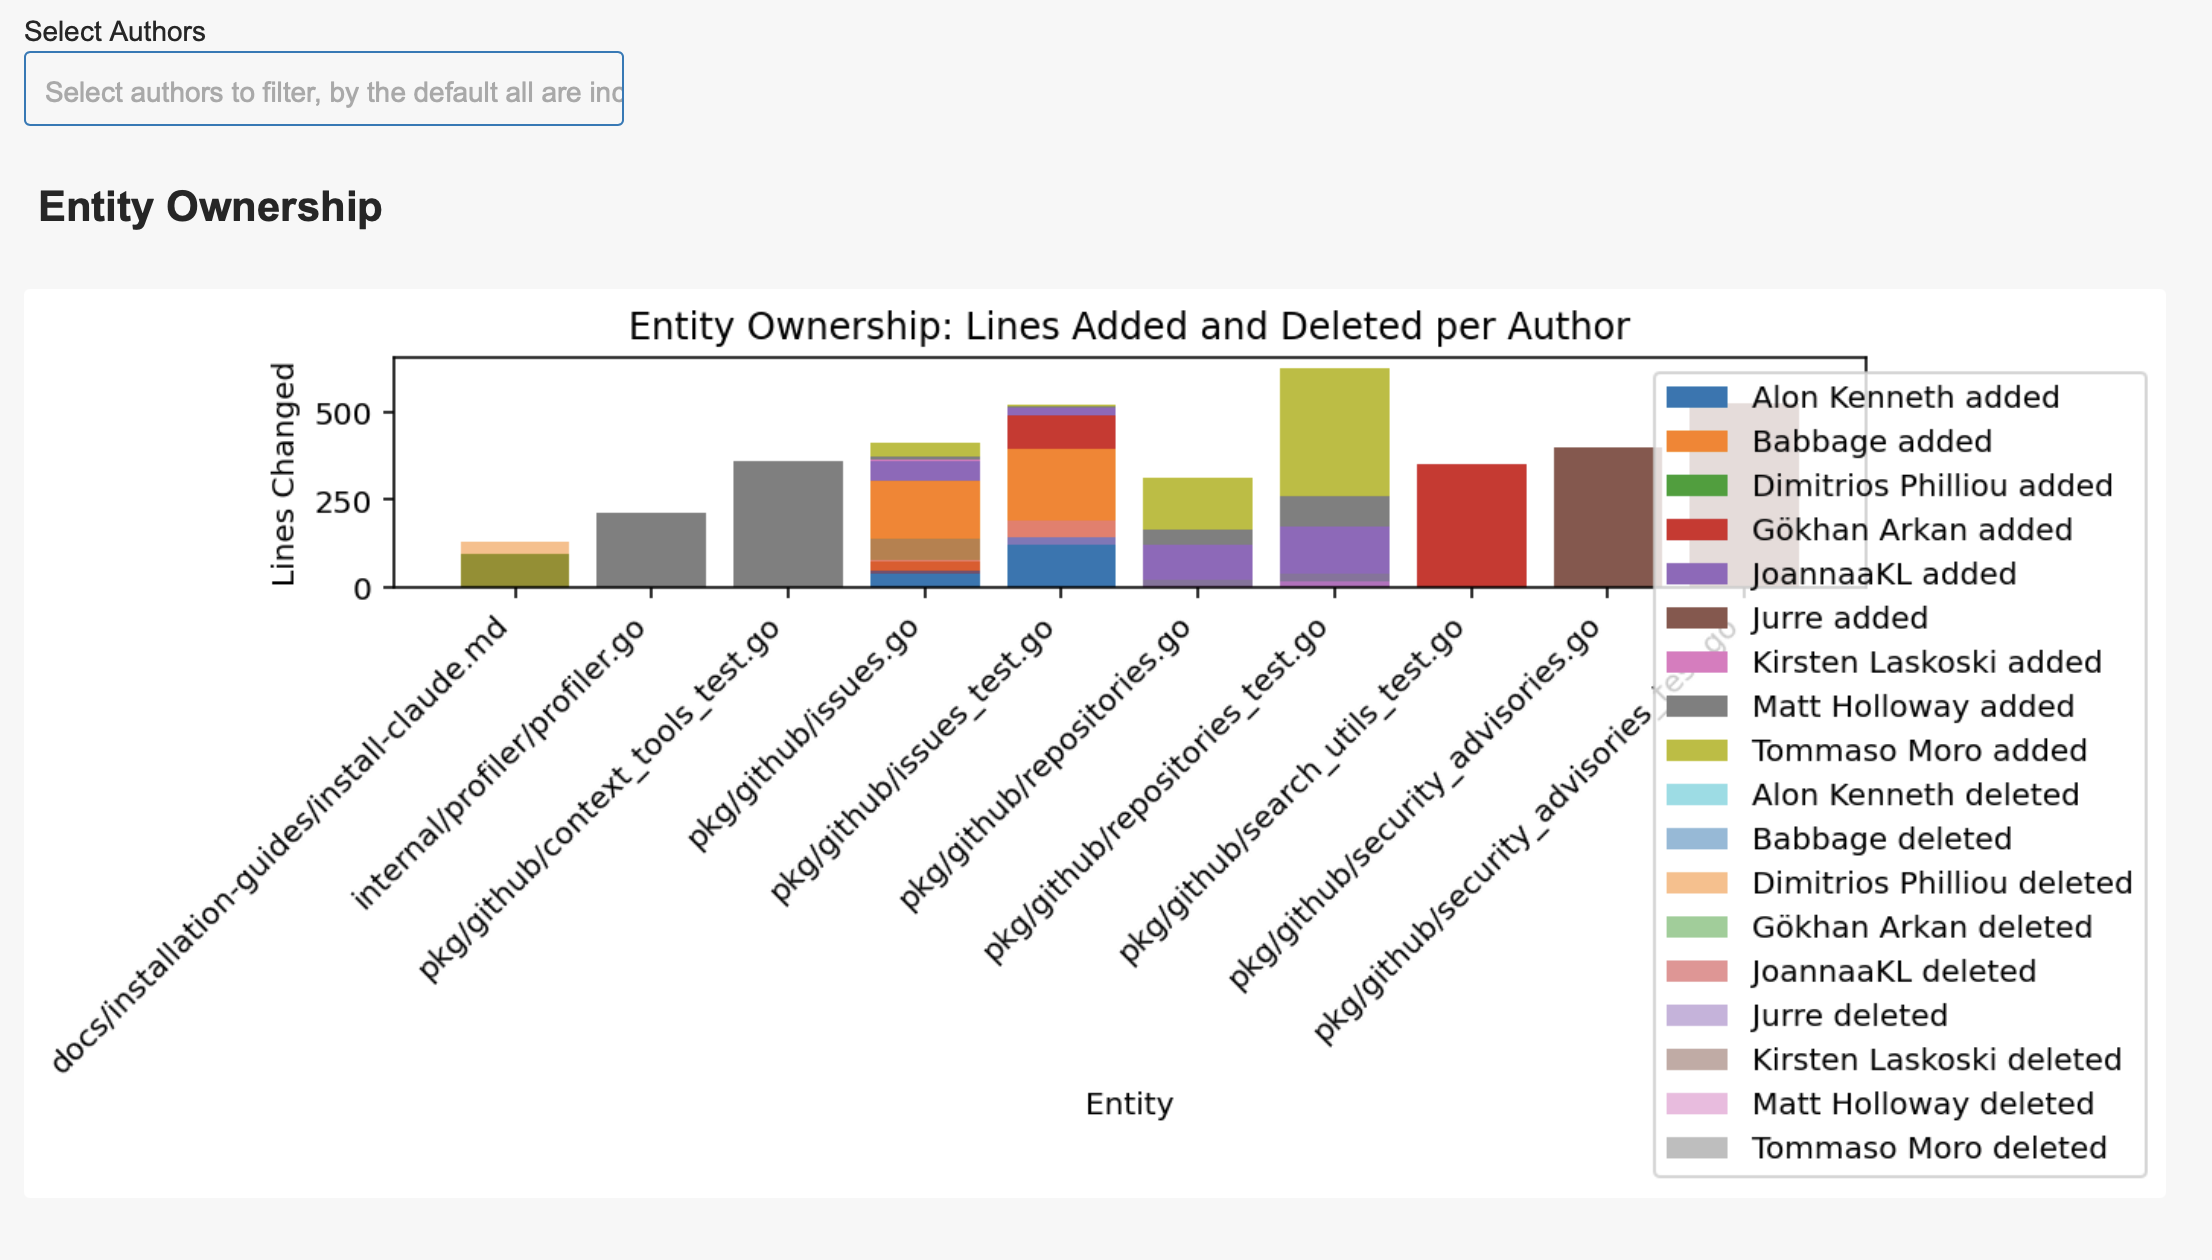
Entity ownership highlights who has contributed to each file, showing the breakdown of changes by author. This chart is invaluable for understanding code expertise and team collaboration. It helps you quickly find out who to ask for help or a review on specific files, and supports onboarding by making team knowledge visible. The chart is interactive, allowing you to explore contributions and filter by author or file.
Type of Chart
Stacked bar chart and tabbed views showing ownership by author, by file, and by entity.
Insight Provided
Highlights code ownership and expertise, making it easy to see who contributed most to each file. This supports collaboration and onboarding by showing who to ask for help or reviews.
Example Usage
Use this chart to identify the main contributors to critical files, or to balance code ownership across the team. For example, if one author owns most of a security module, ensure others are familiar with it too.
How It Computes and Filters
Aggregates lines added and deleted per file, attributing changes to each author. You can filter by author, file, or date range, and interact with the chart to explore contributions in detail.
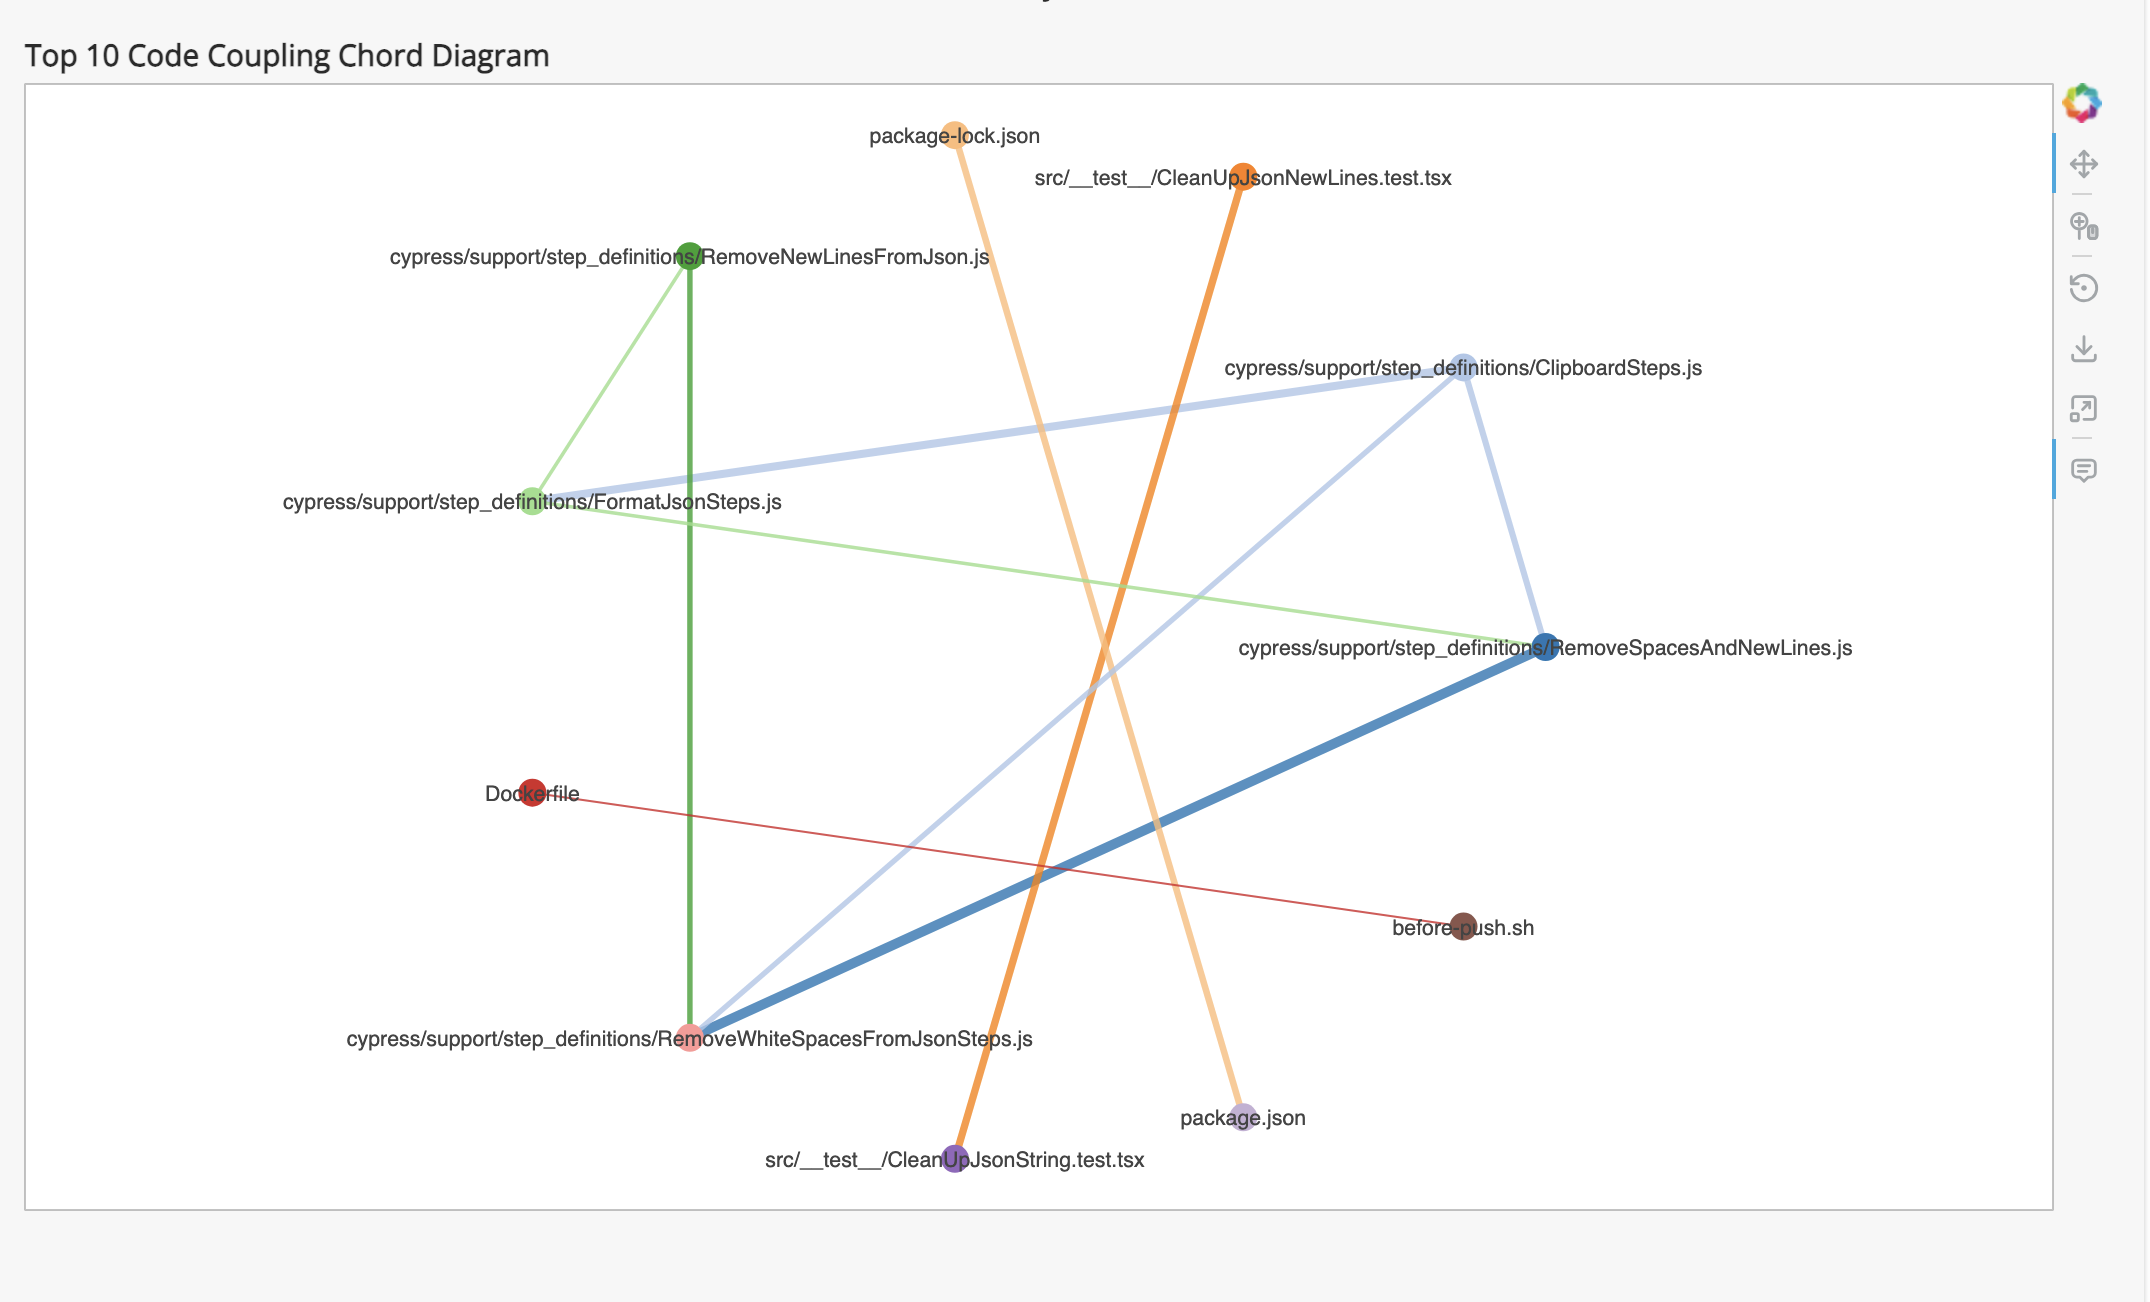
Coupling
Analyzes the coupling between entities in the repository.
Pairing
Pairing metrics reveal collaborative patterns in your codebase by detecting co-authored commits.
The dashboard shows pairing data in two cards:
- Who Paired The Most With Whom: top author/co-author pairs by paired commit count.
- Latest 20 Paired Commits: recent commits with co-authors, linked to the commit in the configured provider.
The Insights tab also shows the Pairing Index summary.
Big O Classification
Analyzes source files for algorithmic complexity risks, assigning a Big O classification and score to each file.
The Big O Classification card lists analyzed files with their detected complexity classification and score. The card includes a search field backed by the big_o_search query parameter and a sortable score column.
Dashboard coverage
The Source Code tab is backed by:
GET /code/code-churnGET /code/couplingGET /code/entity-churnGET /code/entity-effortGET /code/entity-ownershipGET /code/pairing-indexGET /code/big-o
Dashboard filters
Use these filters in the Source Code dashboard tab.
Date range filters
| Dashboard filter | Backend query parameter |
|---|---|
startDate | start_date |
endDate | end_date |
timezone | timezone |
Source Code-specific filters
| Dashboard filter | Backend query parameter |
|---|---|
ignorePatternFiles | ignore_files |
includePatternFiles | include_only |
authorSelectSourceCode[] | authors |
topEntries | top |
typeChurn | type_churn |
For list filters ([]), the dashboard sends comma-separated values.
The shared date picker, timezone behavior, saved views, and tab navigation are documented in Dashboard.
Pattern filtering notes
For include and ignore patterns:
- Plain text values perform substring match.
- Glob-like patterns are supported (
*,**,?). - If the pattern has no
/, matching is applied to file name (basename).
Examples:
*.test.tssrc/**node_modules/*