Pipelines
Works with:
GitHubThe pipelines section is at the core of any CI/CD system. It provides a high-level overview of the pipelines that have been executed, their statuses, and key metrics related to their performance at a glance. It focuses on first, a quick statuses run for the pipelines, and second, on the time it takes to run them.
The dashboard tab currently includes:
- Total runs summary.
- Pipeline Runs Duration with Min-Max Range, Job Breakdown, and Runs by Day tabs.
- Jobs Average Time with By Job and By Day tabs.
- Job Reruns with a reruns-by-day chart and jobs summary table.
- Jobs by Status.
- Job Steps Analysis when exactly one job is selected.
Several tables link to provider pages such as workflow runs, job runs, and workflow metrics when the configured provider supports those URLs.
Fetch pipelines
Date-only values passed to pipeline commands are interpreted with the selected project's configured timezone from smm_config.json. If the project does not set timezone, SMM uses the project-specific SMM_TIMEZONE environment variable, then UTC.
smm pipelines fetch| Option | Description | Example |
|---|---|---|
| Start date | Fetches workflows created after a date. | --start-date=2025-01-01 |
| End date | Fetches workflows created before a date. | --end-date=2025-12-31 |
| Raw Filters | Provider-specific raw filters. See your provider's API docs for available fields. | --raw-filters=status=success,branch=main |
| Step | Defines the pace in which data is fetched. Helps mitigate API rate limits. | --by-day |
| Force | Force re-fetch pipelines even if already cached. | --force |
| Update | Incrementally update pipelines — fetch only newer items and merge with existing cache. | --update |
Example with an explicit timezone from the environment:
YOUR_ORG_FRONTEND_APP_SMM_TIMEZONE=Europe/Madrid smm --project your-org/frontend-app pipelines fetch --start-date=2025-01-01 --end-date=2025-12-31Fetch Jobs
Pipeline jobs are the individual CI steps that make up a pipeline run. Fetch them after pipelines so the job data is linked to the runs already stored.
smm pipelines fetch-jobs| Option | Description | Example |
|---|---|---|
| Start date | Filter pipelines created on or after this date for job extraction. | --run-start-date=2025-01-01 |
| End date | Filter pipelines created on or before this date for job extraction. | --run-end-date=2025-12-31 |
| Raw Filters | Provider-specific filters for the pipeline runs the jobs belong to. | --raw-filters=branch=main |
| By Day | Fetch jobs day by day to mitigate provider rate limits. | --by-day |
| Force | Force re-fetch jobs even if already cached. | --force |
| Update | Incrementally fetch only newer jobs and merge with existing cache. | --update |
smm pipelines fetch-jobs --run-start-date 2025-01-01 --run-end-date 2025-06-30 --by-dayOutliers and weekend filtering
Pipeline duration metrics can be skewed by unusually slow runs, retries, provider incidents, or weekend-only activity. CLI commands that compute averages expose two cleaning options:
--weekends include|exclude|weekends_only
--outlier-mode include|flag|exclude
--weekends controls the sample set before averages are calculated. Use include to keep all samples, exclude to use weekday samples only, or weekends_only to inspect weekend executions separately.
--outlier-mode controls detected outliers. Use include to keep all samples without reporting outliers, flag to keep all samples and print outliers, or exclude to remove outliers before computing the average. Outliers are detected with the interquartile range rule: values outside Q1 - 1.5 * IQR and Q3 + 1.5 * IQR are flagged. Weekend filtering runs before outlier detection.
These options are available on smm pipelines summary, smm pipelines runs-duration, smm pipelines jobs-summary, smm pipelines jobs-time-execution, smm pipelines jobs-steps-time, smm pipelines jobs-by-status, and smm pipelines lead-time.
Matrix jobs (parallel legs)
Providers such as GitHub Actions fan a matrix job out into several parallel legs and append a parenthesized index to each leg's name, for example test (1), test (2), test (3). Because these legs run concurrently, they all occupy the same window of wall-clock time — running them in parallel does not multiply the elapsed time.
To reflect this reality, SMM collapses all parallel matrix legs onto their base name before computing job metrics. The base name is the only name you will see — the individual test (1), test (2), test (3) leg names never appear in the results. Instead, they are all aggregated and shown as a single row named test.
This applies to every job-based calculation: Jobs Average Time, Jobs Average Time by Day, Jobs Summary, Jobs Duration by Workflow, and the deployment-frequency target matching. Only the trailing numeric index is stripped, so meaningful parentheses earlier in the name are preserved — for instance deploy (prod) (1) is normalized to deploy (prod) and shown as deploy (prod), not as deploy.
As a result:
- Three parallel
test (N)legs are reported as a singletestjob withtotal_runs = 3. - Their average duration is the mean of each leg's own duration (for example
5 min), not the sum of their durations. - A deployment-frequency target named
deploymatchesdeploy,deploy (1),deploy (2), etc.
Run-level duration is computed from the earliest job start and the latest job completion across the whole run, so it is already parallel-aware and is unaffected by this normalization.
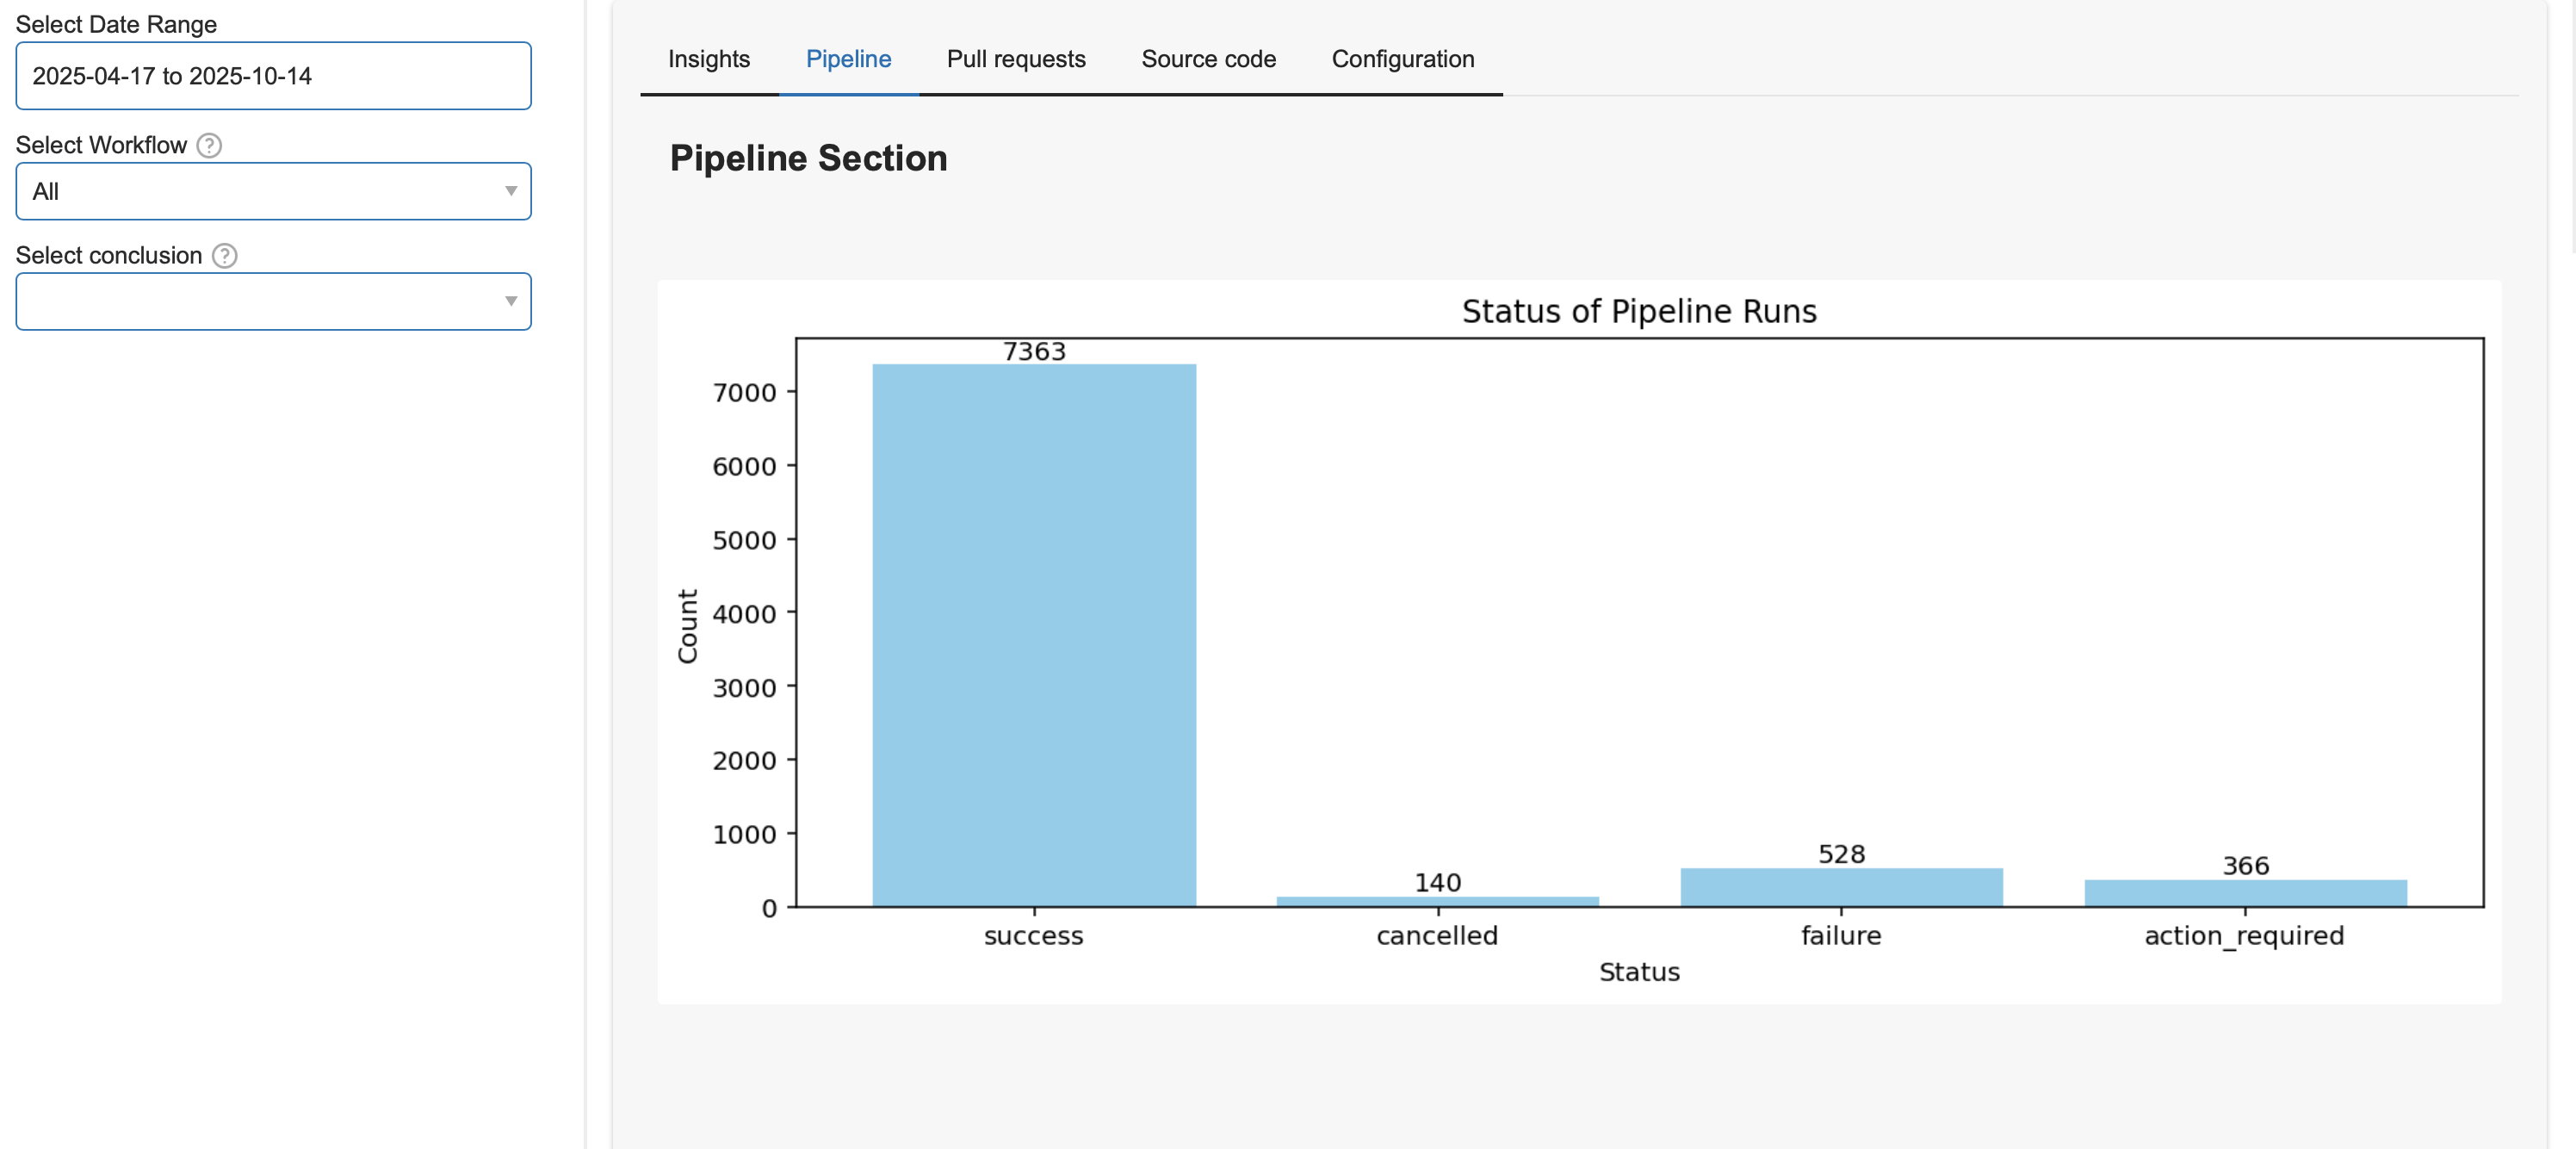
Pipeline by Status
Pipeline Runs by Time
Computes the number of pipeline runs over time and returns a time series plot showing how many pipeline executions were triggered in the given time frame. Aggregated by week or month.
Available as the Pipeline Runs by Day card in the Pipeline Runs Duration section of the Pipelines tab.
Pipeline Runs Duration
Computes the duration of each pipeline run over time and returns a time series plot showing how long each pipeline execution took to complete in minutes. The time taken is calculated based on the sum of all individual jobs executed in the pipeline, excluding skipped jobs.
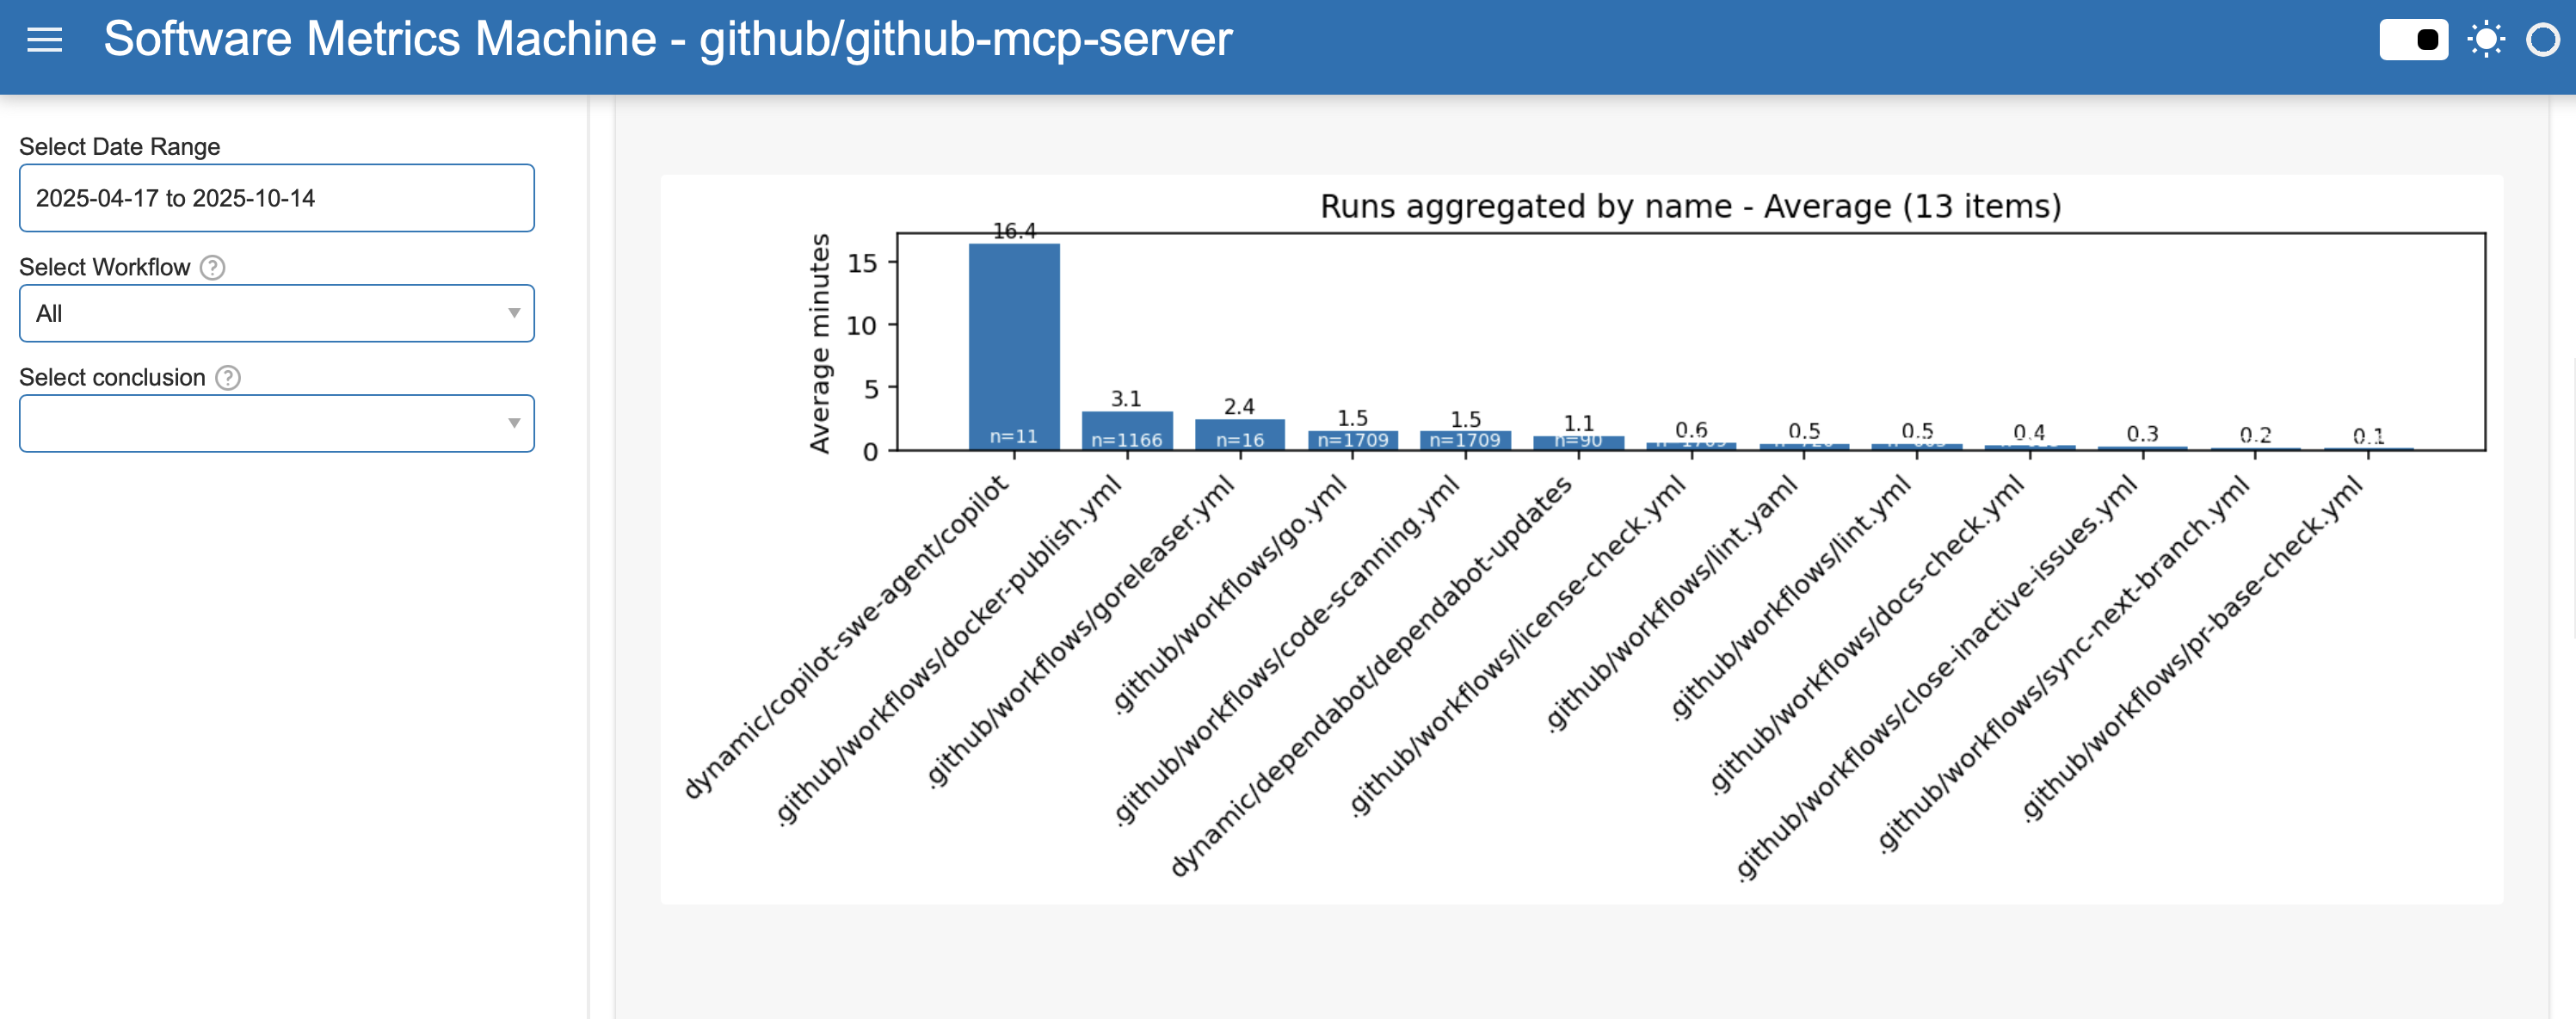
Pipeline Summary
Summary of pipelines executed showing total runs, statuses, first and last run available from the data.
Available in the Insights tab as the Pipeline Runs summary card and in the Pipelines tab as the Total runs summary.
Jobs Execution Time
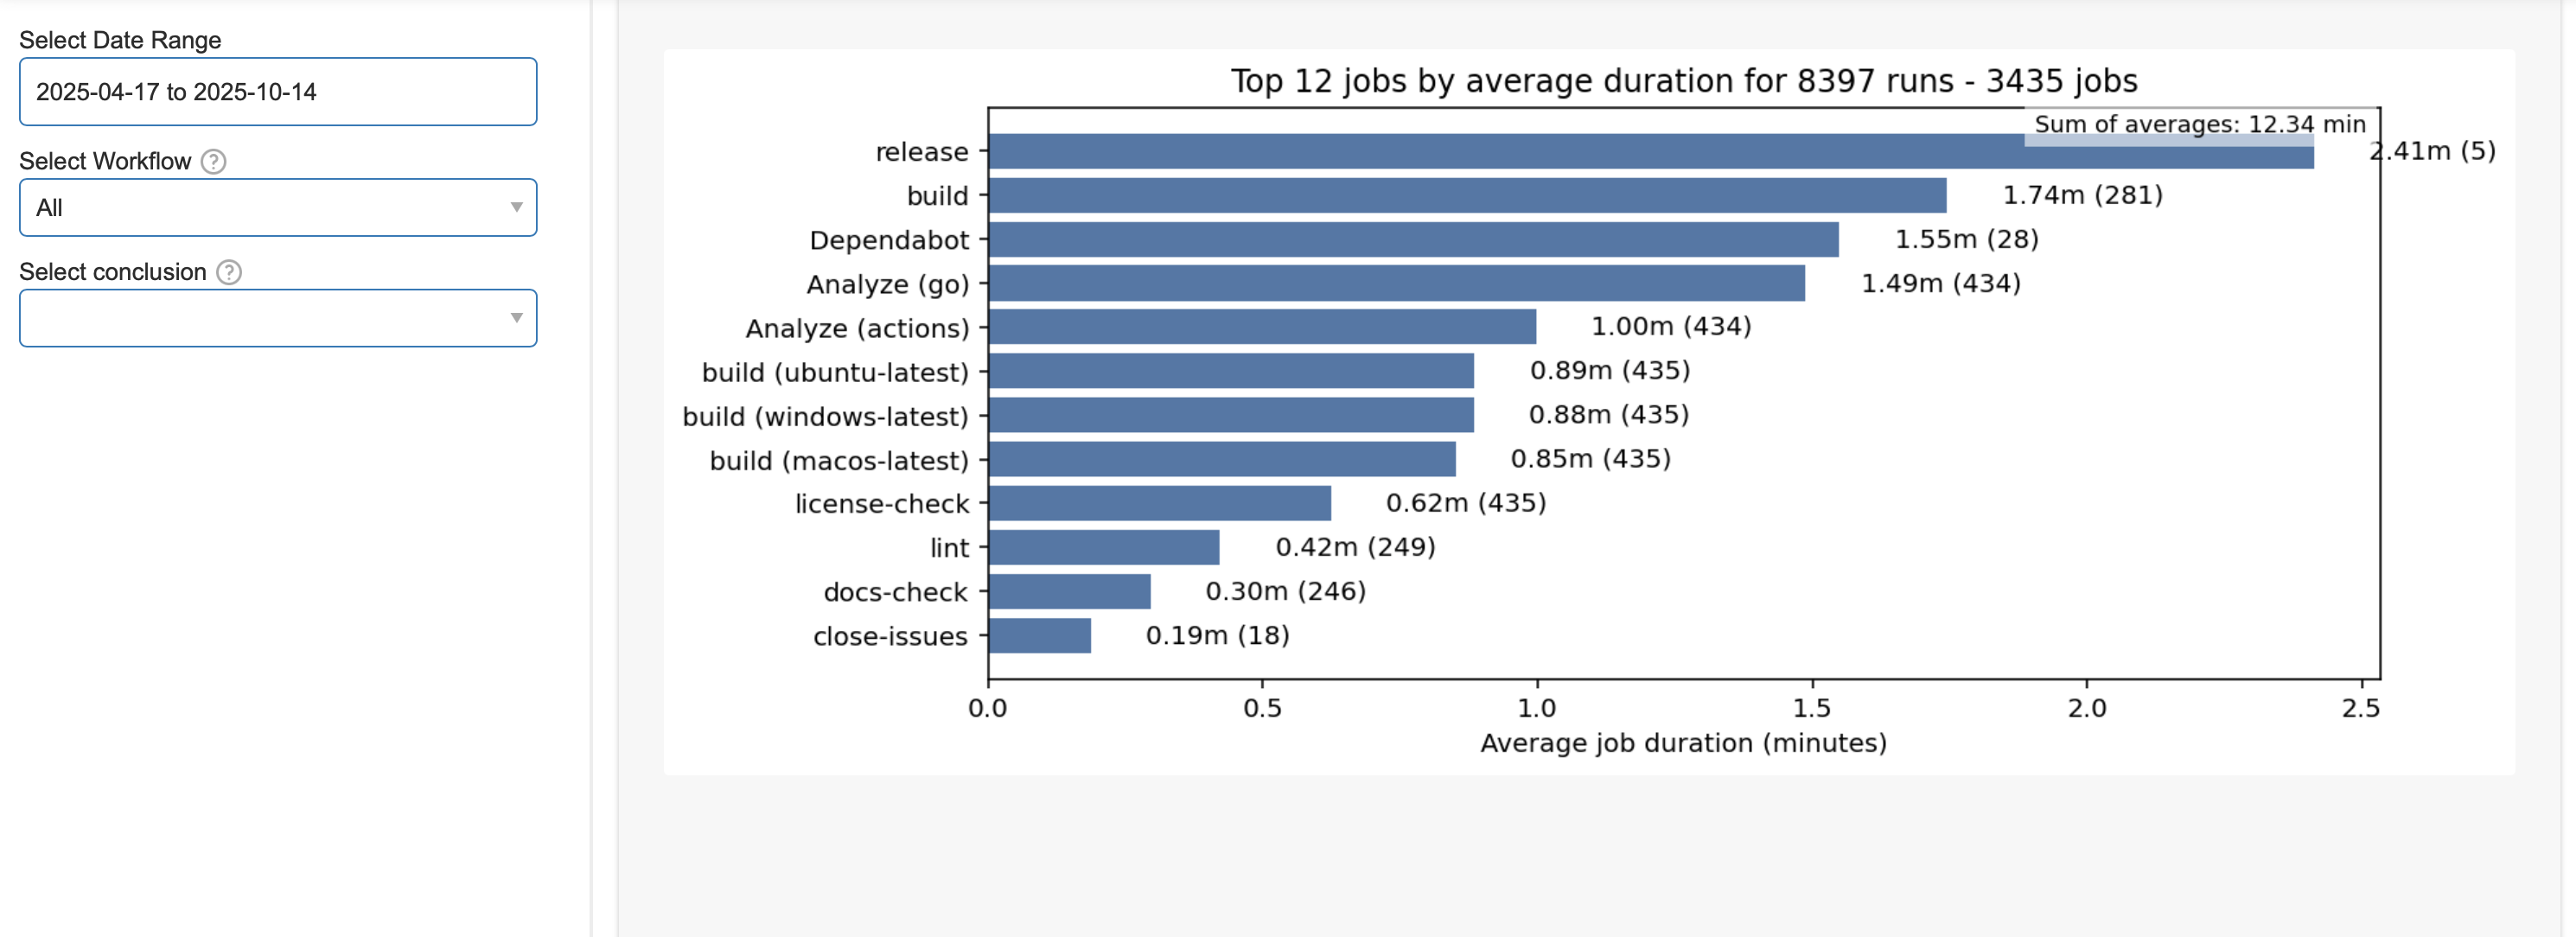
Jobs are the building blocks of any pipeline. They represent individual tasks or steps that need to be executed as part of the overall pipeline process. This command associates the jobs wih their corresponding pipeline execution.
In the dashboard, the Jobs Average Time card can be viewed by job or by day.
Jobs by Status
Available as the Jobs by Status card in the Pipelines tab.
Jobs Summary
Available in the Job Reruns card as the Jobs Summary table. It includes total runs, average duration, success/failure counts, success/failure rates, and rerun count.
Job Steps Analysis
When exactly one job is selected in the dashboard filters, the Pipelines tab shows step-level analysis for that job. The card includes:
- Average step duration by day.
- Overall time proportion by step.
- A sortable table of steps, average duration, and count.
Available when job is selected in the filters.
Deployment Frequency
Calculates deployment frequency, a key DORA metric that measures how often code is successfully deployed to production. Requires deployment frequency targets to be configured in smm_config.json. See Configuration for setup details.
Available in the Insights tab as the Deployment Frequency DORA card.
Lead Time for Changes
Calculates lead time for changes, a DORA metric that measures the time from code commit to code successfully running in production.
Available in the Insights tab as the Lead Time DORA card.